Testing & Measurements

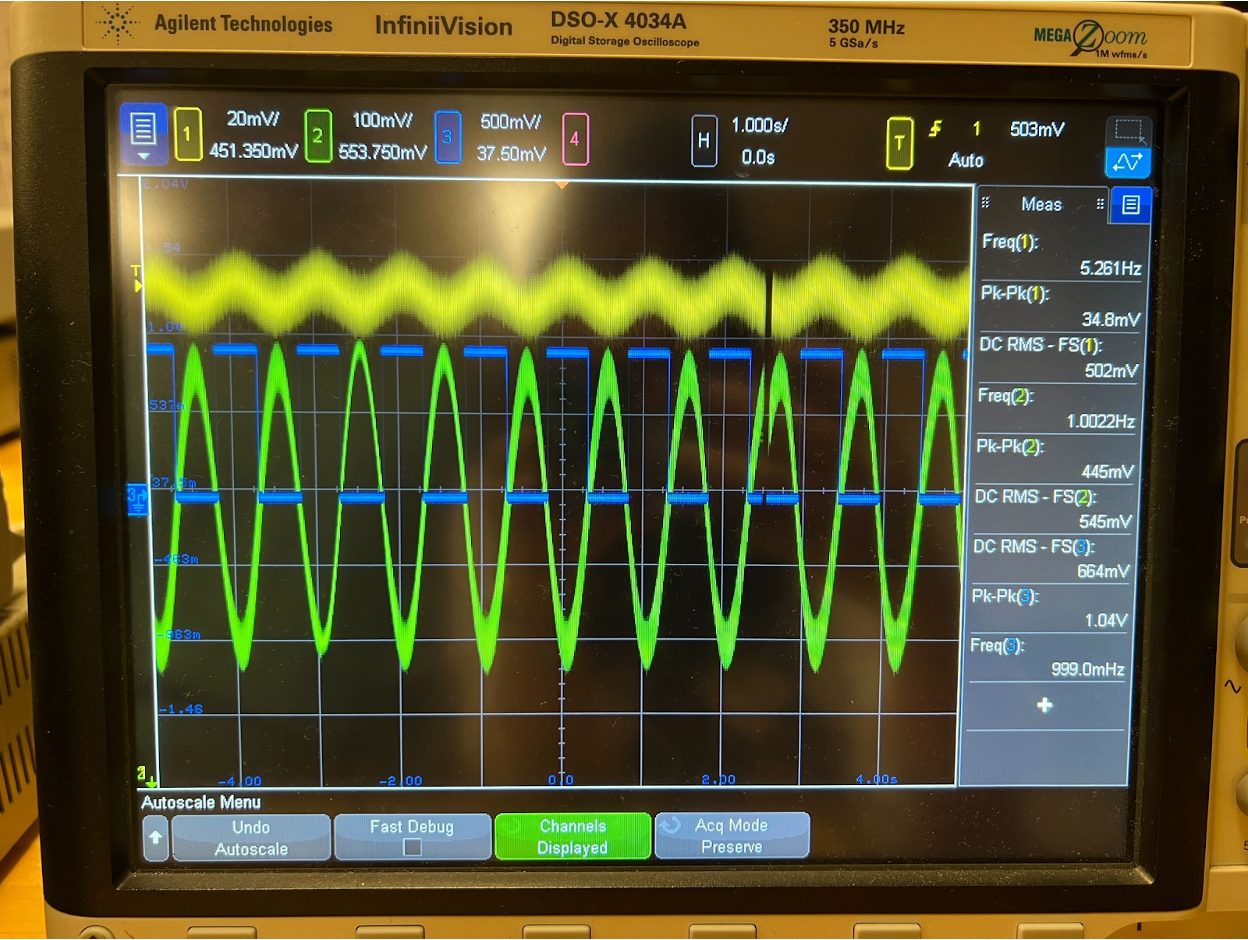
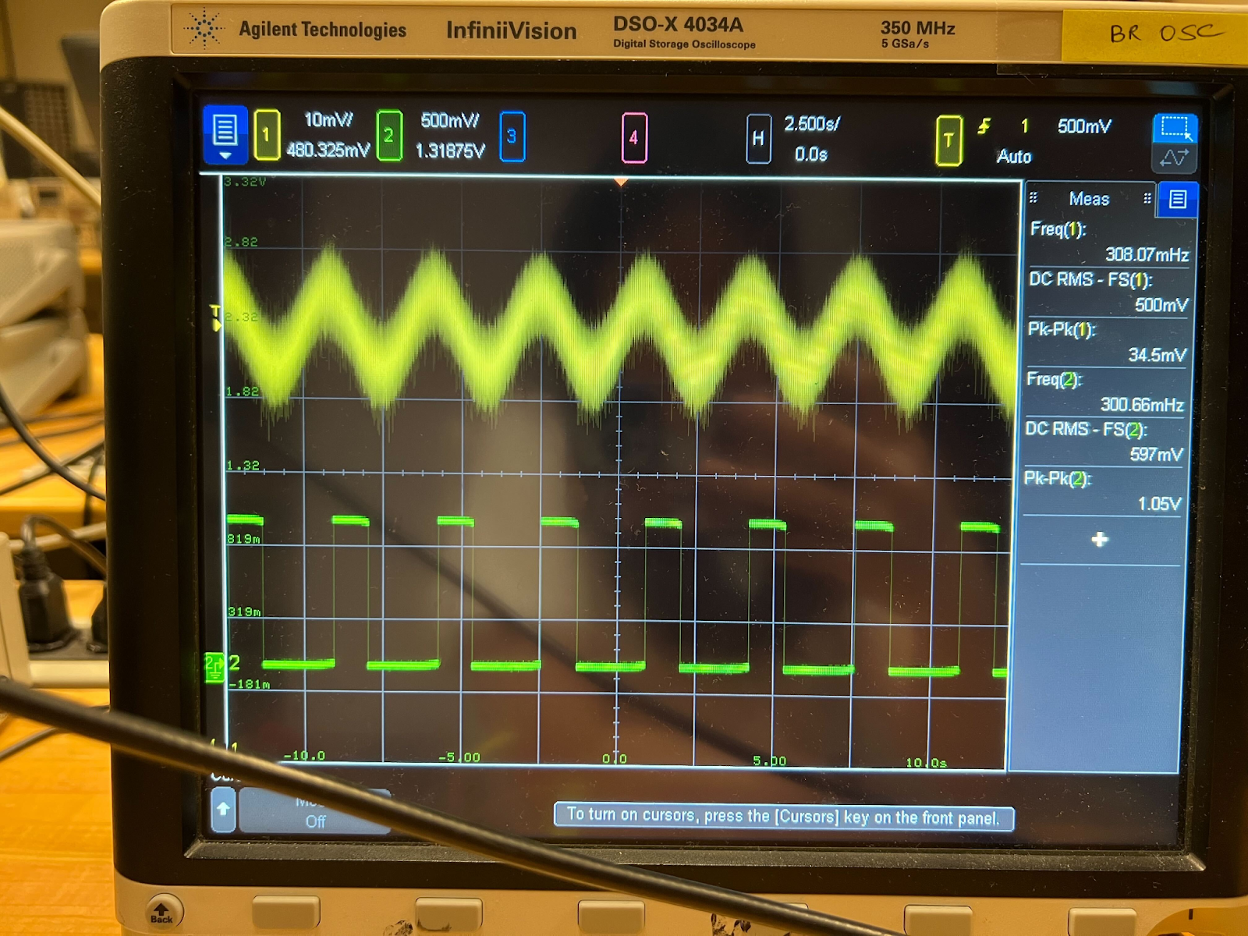
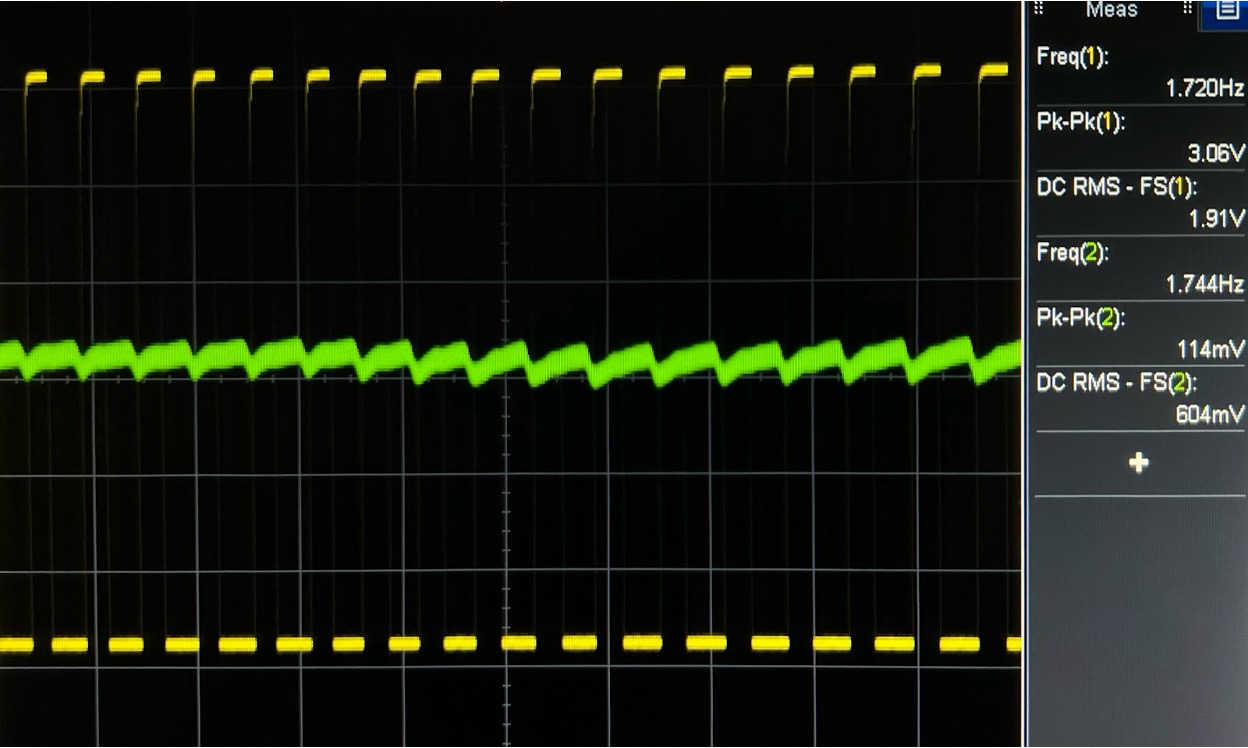
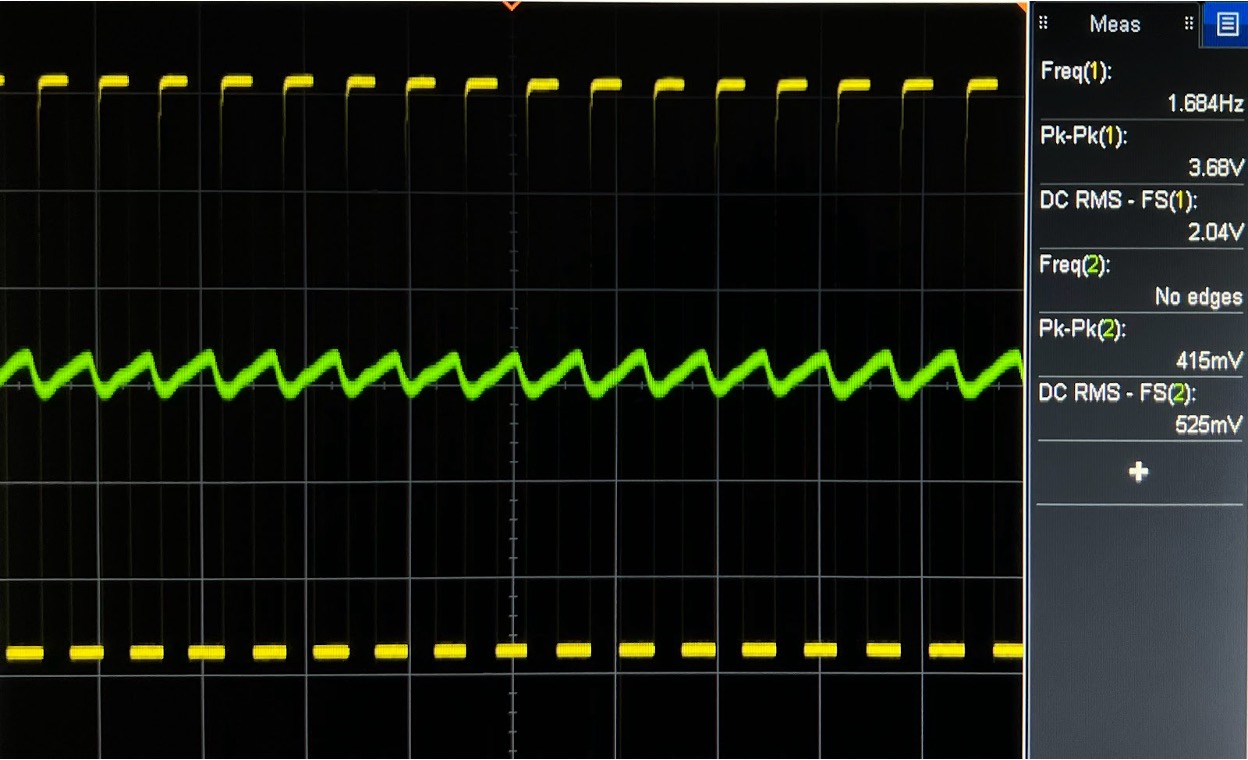
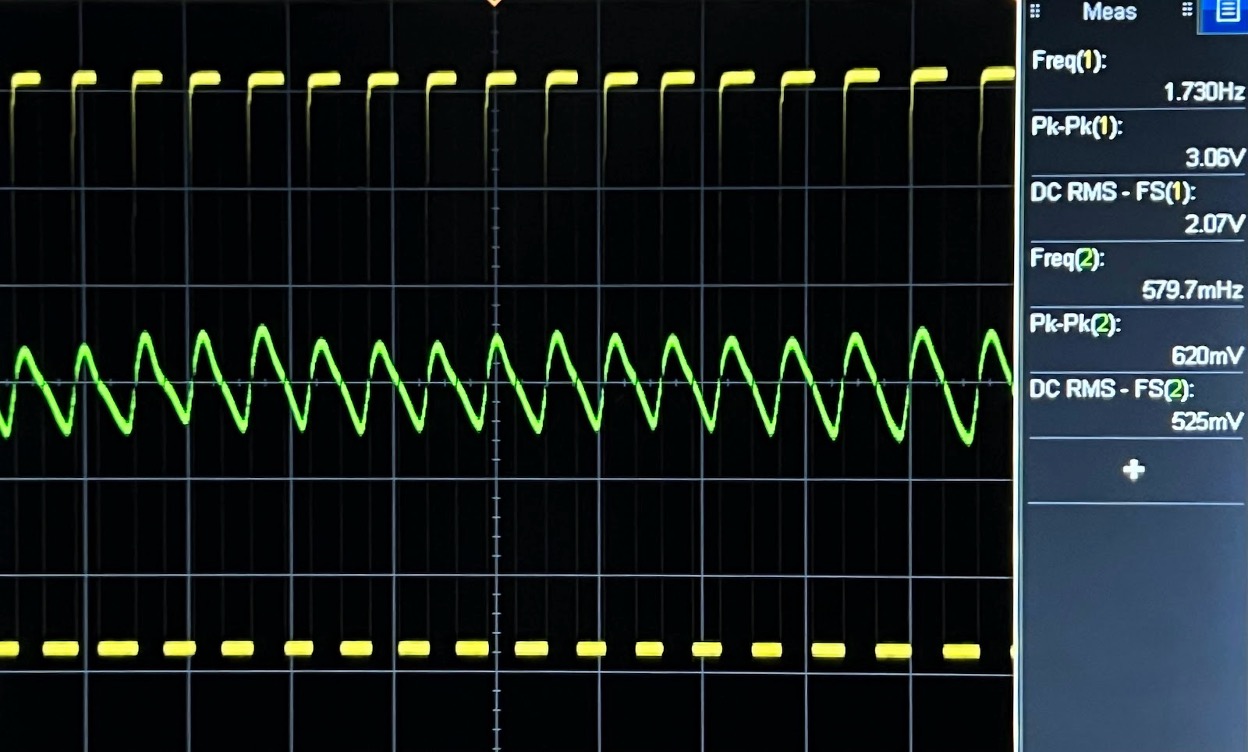
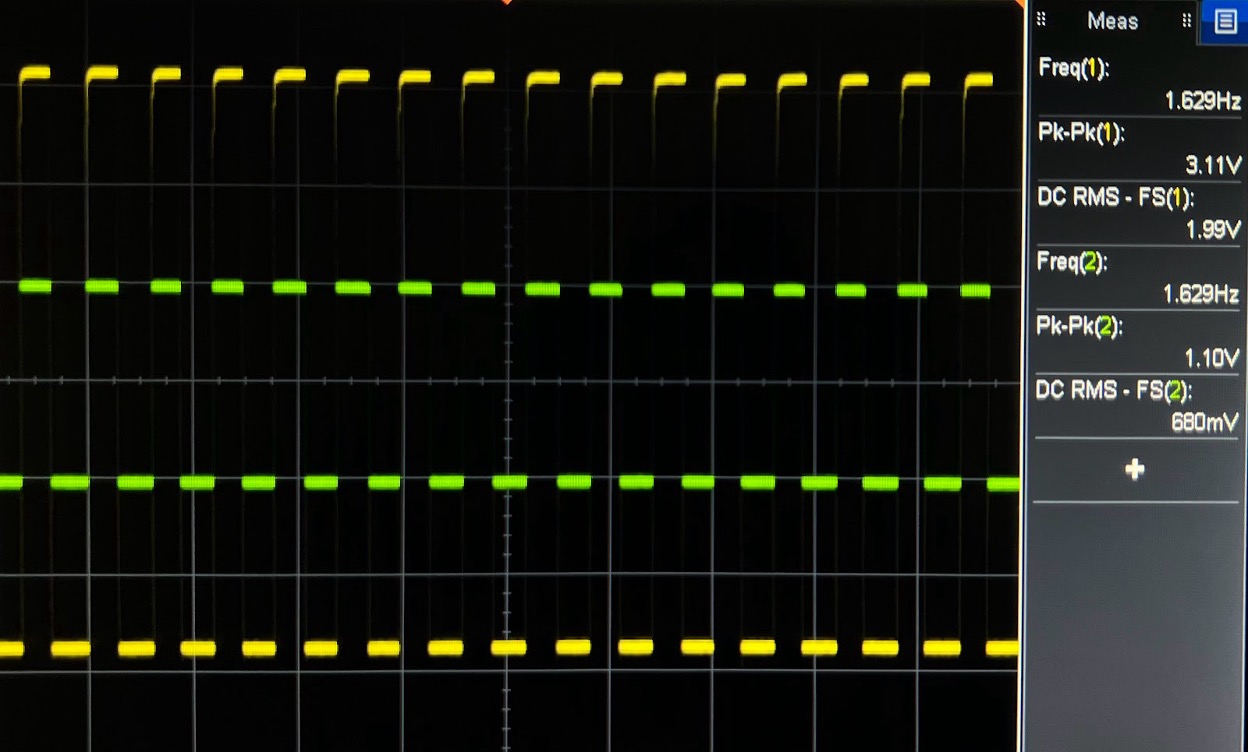
The testing process was a step by step process that alternated between using an single frequency sinusoidal input from a waveform generator (testing with a 0.2-0.4Hz range for breathing rate and 1-2Hz range for heart rate) and the output of the sensor board.

Sensor Board
Fig.1 - Sensor Board used for Generating HR/BR signals
The sensor board mentioned is featured above. The on-board LEDs and photodiode have been used to generate a photocurrent that is fed through a large 1uF capacitance used to AC couple the signal into the TIA.

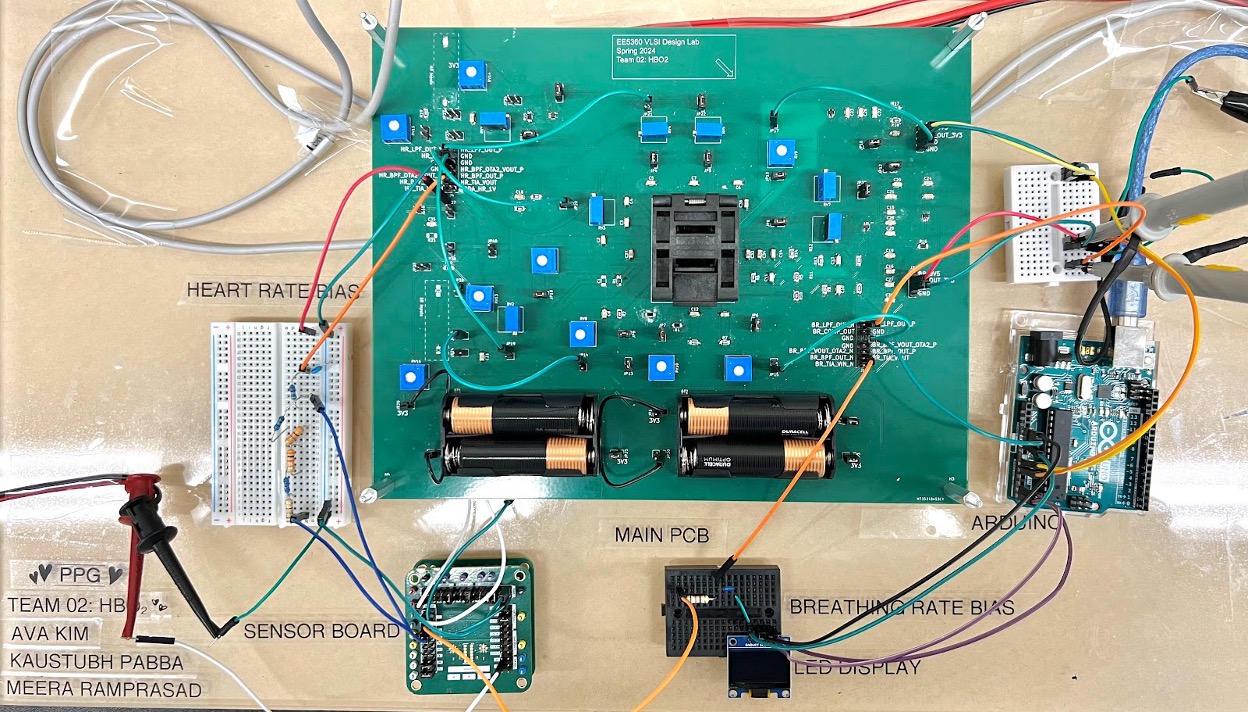
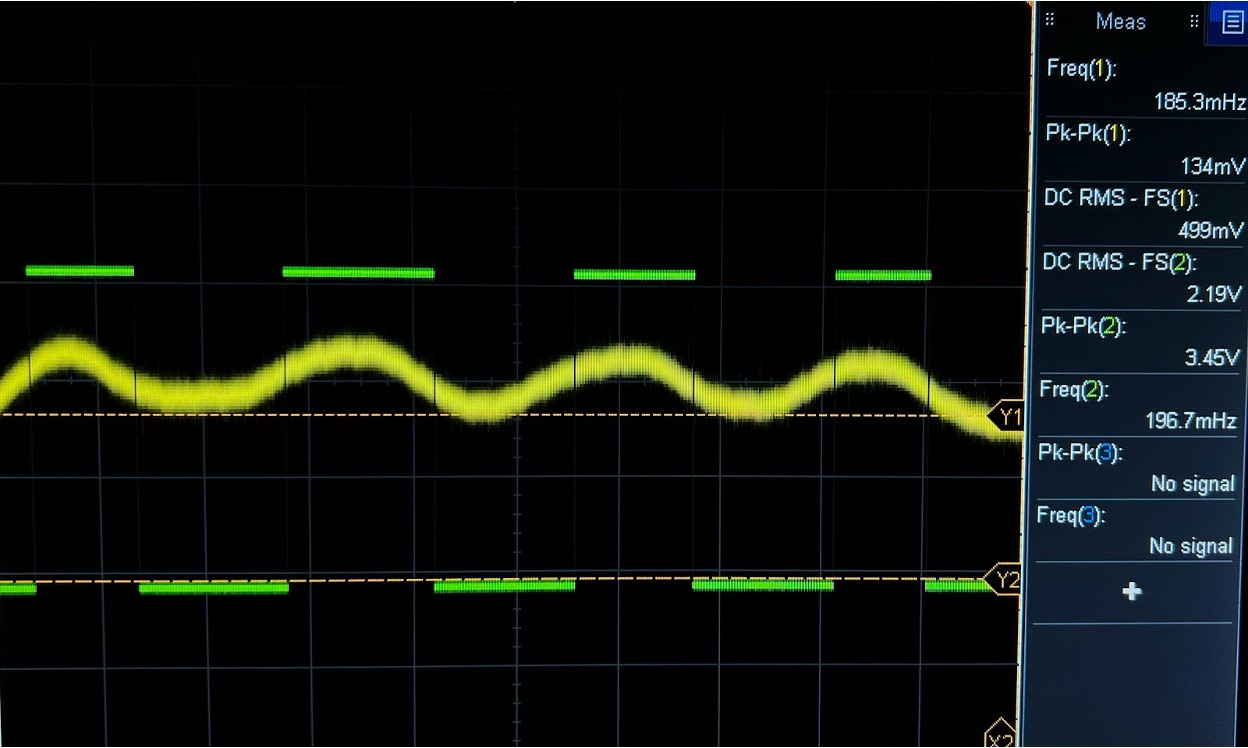
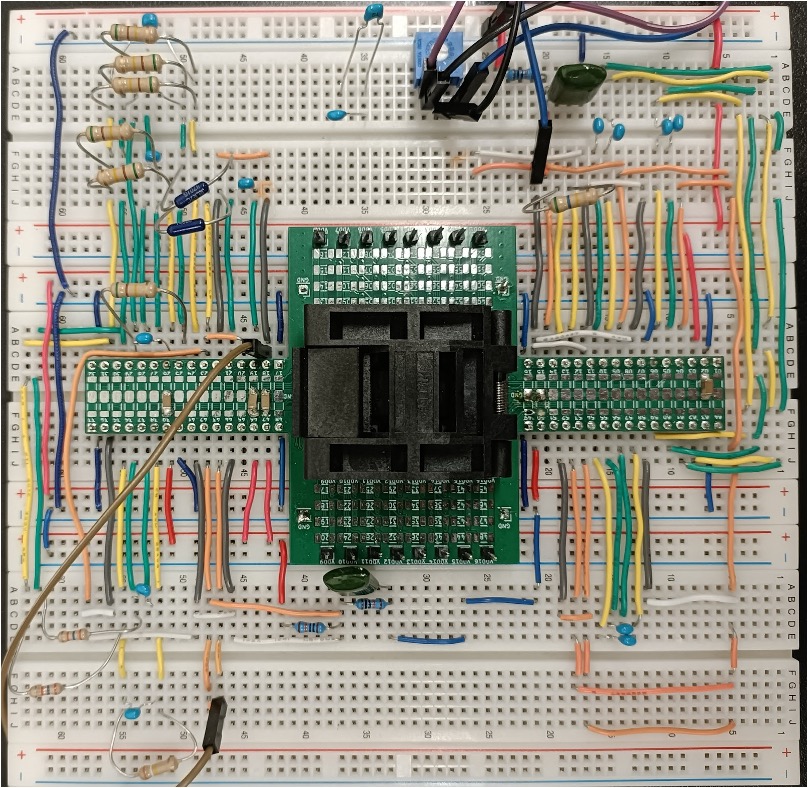
Below is the breadboard setup that emcompasses both breathing and heart rate using a provided socket PCB that allows the pinouts of the chip to be accessible on the breadboard. This setup was used until the custom PCB was able to be utilized.
Breadboard
Fig.2 - Breadboard setup
To test the real life functionality of the chip and signal chain an ideal sinusoidal wave carrying a single frequency within our desired frequency range had been used to verify if our signal chain sufficiently amplified and switched the comparator. The voltage signal from the waveform generator was fed through a resistor to obtain an oscillating current that could be fed into the TIA.

Below are the successful results obtained from the process for both signal chains:
HR Full Measurement
Fig.3 - Heart Rate (HR) simulation with ideal signal input from waveform generator of 1Hz (blue = comparator output)
HR Full Measurement
Fig.4 - Breathing Rate simulation with ideal ideal signal input from waveform generator of 0.3Hz (green = comparator output)
Note: The peak to peak and frequency values for the sinusoidal waves shown on the oscilloscope are not entirely reliable due to the oscilloscope not accounting for noise, particularly at lower amplitudes. Once the functionality of the chip had been verified with an ideal waveform at the target frequencies, the testing moved on to the custom PCB setup, shown below.
Full Setup
Fig.5 - PCB Measurement Setup
Using a real signal from the sensor board required adaptive changes in the signal chain, such as boosting gain at the TIA stage (150k->200k for breathing rate) and determining which light source would be most ideal for the measurements. (See “Introduction” tab for an explanation of which LED has been used and why.) This setup successfully resulted in sufficient amplification and filtration of the photocurrent into a single frequency analog waveform that could switch the comparator and be read by the arduino. Below are the outputs of each stage compared to the level shifted comparator output (“HR_3v3”) for heart rate for reference. The 3V3 outputs correspond to the output from the level shifter at the end of the signal chain.
HR TIA
Fig.6 - HR_3v3 & TIA Output
HR BPF
Fig.7 - HR_3v3 & BPF Output
HR LPF
Fig.8 - HR_3v3 & LPF Output
HR Comp
Fig.9 - HR_3v3 & HR Comparator Output
In a similar vein, below is the analog and comparator output of the breathing rate. The slight remains of the suppressed heart rate superimposed on the amplified breathing rate signal is visible at the analog output, however, the suppression in the amplitude does not trigger any switching at the comparator output due to its hysteresis.
BR
Fig.10 - BR_3v3 & BR_LPF Output


Back to top