
System Overview
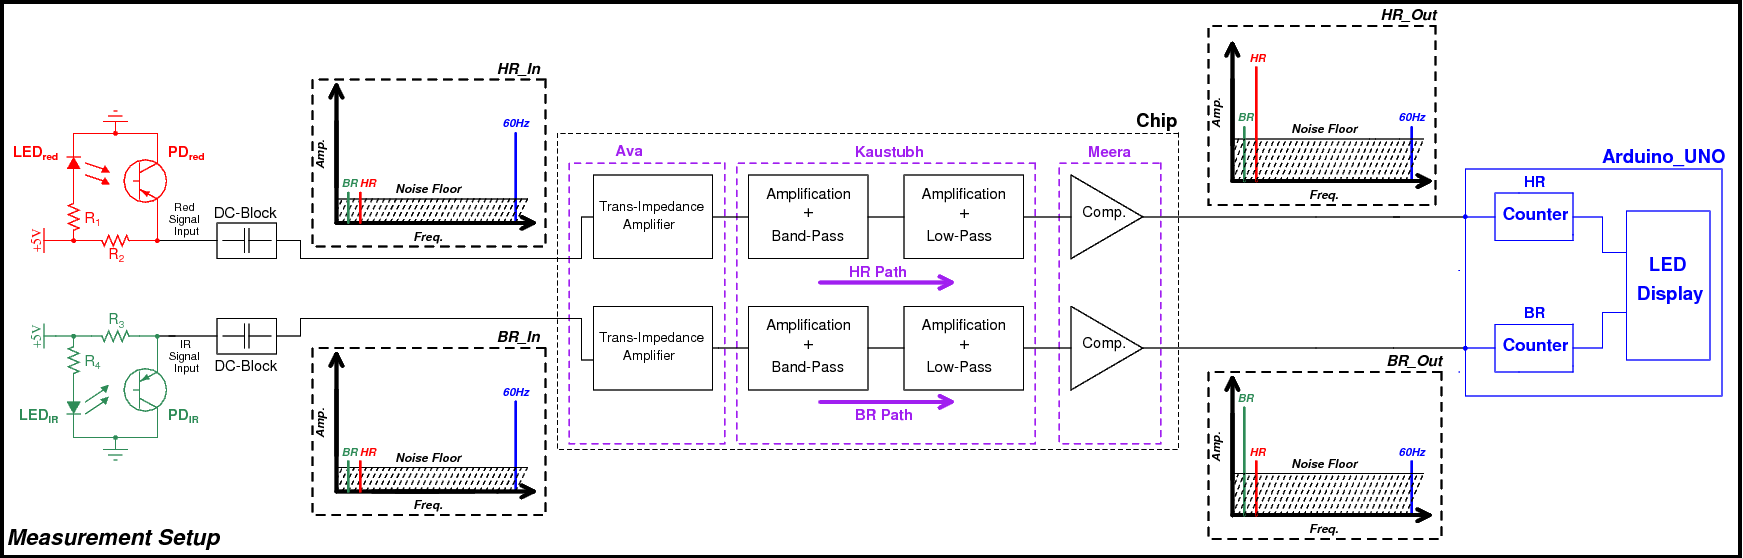
This figure depicts the measurement setup in a pictorial fashion. Starting from left, the LEDs and photodiodes are connected on the sensor board. After one places their finger on this LED & photodiode combination, light emanating from the LED gets reflected from blood vessels inside and the photodiode picks up this signal and processes it.
This signal consists of both AC and DC components. The HR and BR information can be computed from the AC part of the signal, and this is filtered using the DC blocking capacitor on our PCB and sent to the chip as an input.
These inputs are roughly represented in a pictorial fashion as HR_In and BR_In in the figure. The required breathing and heart rate signals are very close to the noise floor near the input, whereas the interference (60Hz) that couples from the supply voltage is much higher than the noise floor in comparison.
The designed chip consists of three distinct functional blocks that amplify and filter the required signals for each (HR/BR) path, they are: the Trans-Impedance Amplifier (TIA), Bandpass and Lowpass Filtering (BPF & LPF) and Comparator. The signal path designed on the chip makes sure that the respective signal is ultimately converted into a square wave at the chip’s output and then processed digitally.
The expected output waveforms for each path are represented pictorially as HR_Out and BR_Out respectively. For HR, BR and supply interference are attenuated whereas the HR signal is selectively filtered and amplified before being fed to the comparator for non-linear amplification. For BR, HR and supply interference are attenuated whereas the BR is selectively filtered and amplified, before being converted into a square wave signal by the comparator.
These square waveforms at the outputs of each path are then processed digitally using an Arduino. As the supply voltage for the chip is 1V, peak-to-peak swing of 1V is insufficient for the Arduino to process as an analog input. As a workaround, we use on-PCB level shifters that increase the peak-to-peak voltage swing from 1V to 3.3V before being sent to the Arduino.
By using a custom code written specifically by us to compute the number of beats per minute for each signal path, we measure the number of cycles elapsed within a 60 second window once the square wave input settles. This number is then displayed on the LED display that is takes the Arduino digital outputs as inputs.
The two signal chains are essentially made up of similar components - the transimpedance amplifier, the bandpass & lowpass filters (which are in turn realised using the Fully Differential Amplifier) and the Comparator. Each of these components are individually discussed in the upcoming webpages.