Simulation
In this section, the post-layout simulation results of each basic building block in the chip are introduced.
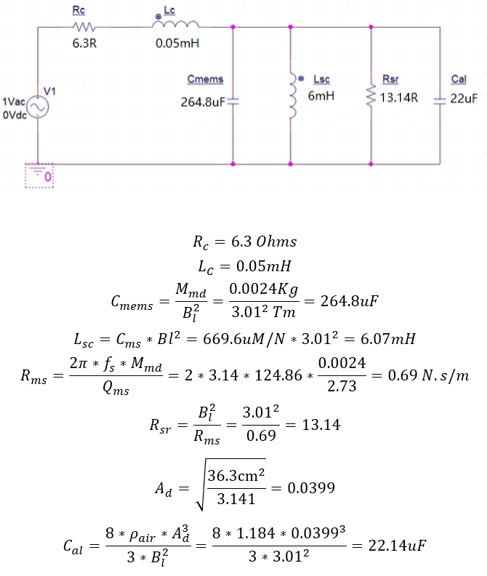
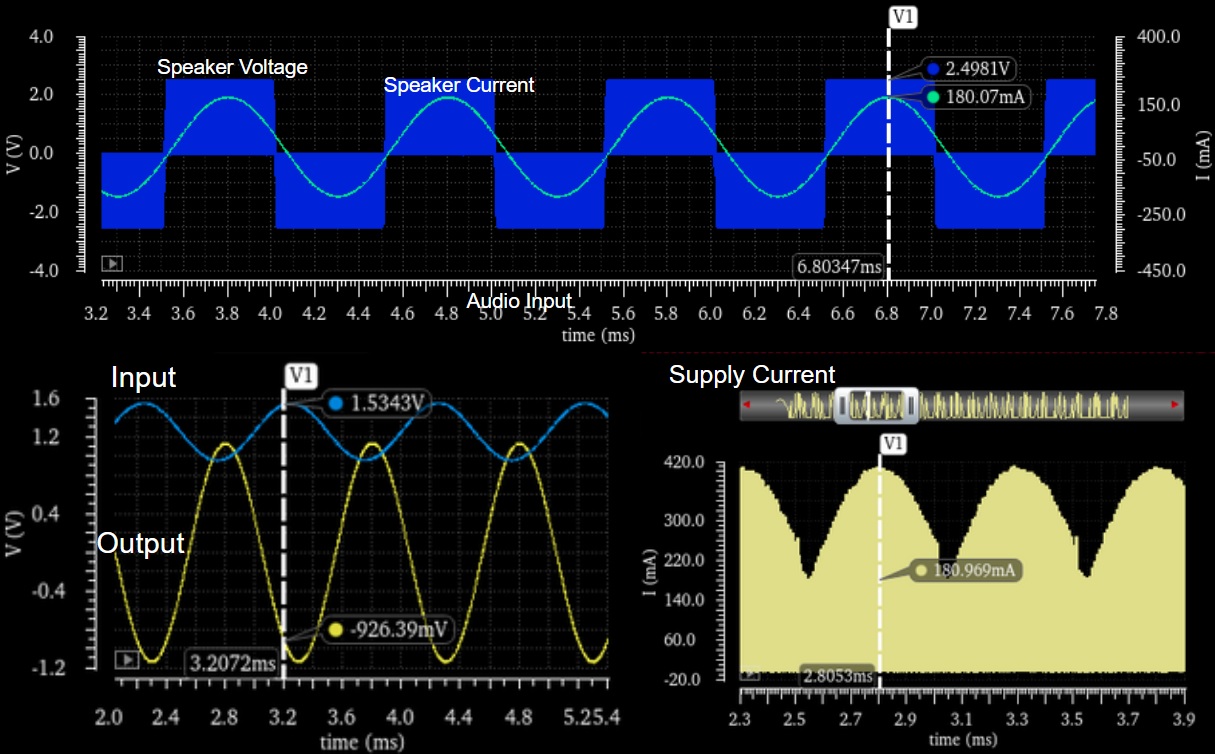
Figure 1: System Simulation Figure 2: Miller OTA Simulation Figure 3: Triangle Wave Generator Figure 4: Speaker Model
System Simulation
In Figure 2, post-layout simulation result shows that the OTA has a gain of 75dB, a phase margin of 80 degrees, and a GBW of 33MHz under TT corner. The PVT simulation proves its stability.

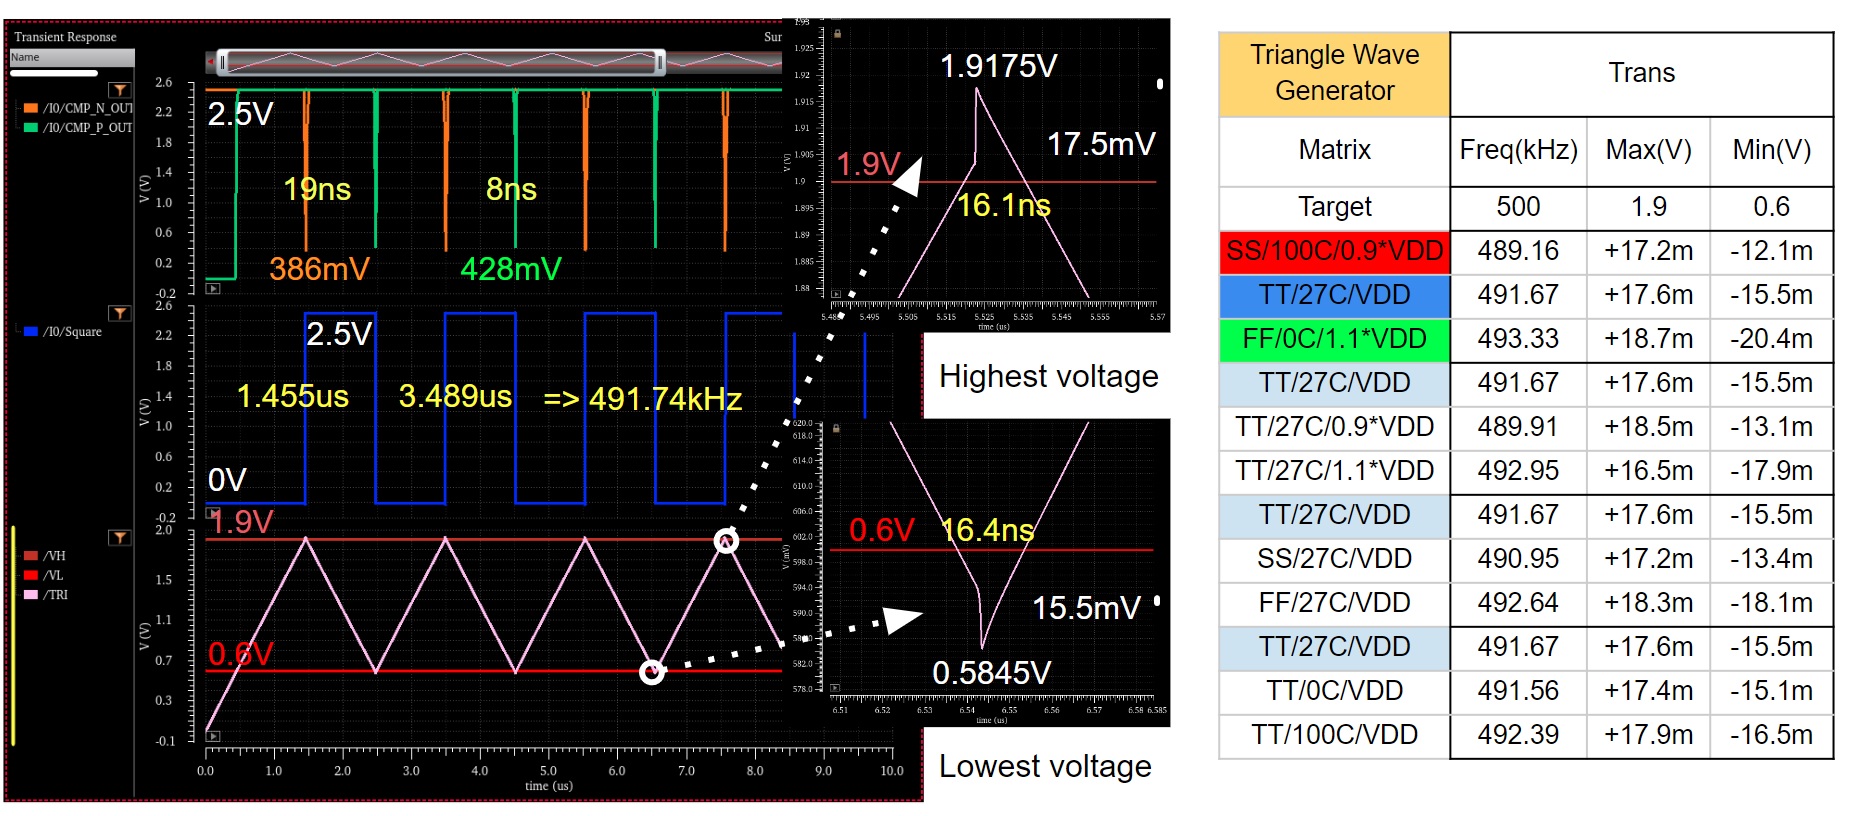
Post-layout simulation result presents that the frequency is about 490kHz under PVT variation, as shown in Figure 3. Although it is slightly lower than expected 500kHz, it is stable and much higher than the maximum frequency of input audio signal, so it is acceptable. The difference comes from the comparator hysteresis, which is about 17mV for both of the comparators.