Testing
Figure 1 shows the Triangle wave from the on-chip Triangle wave generator, it is tuned to 500kHz in normal operation.
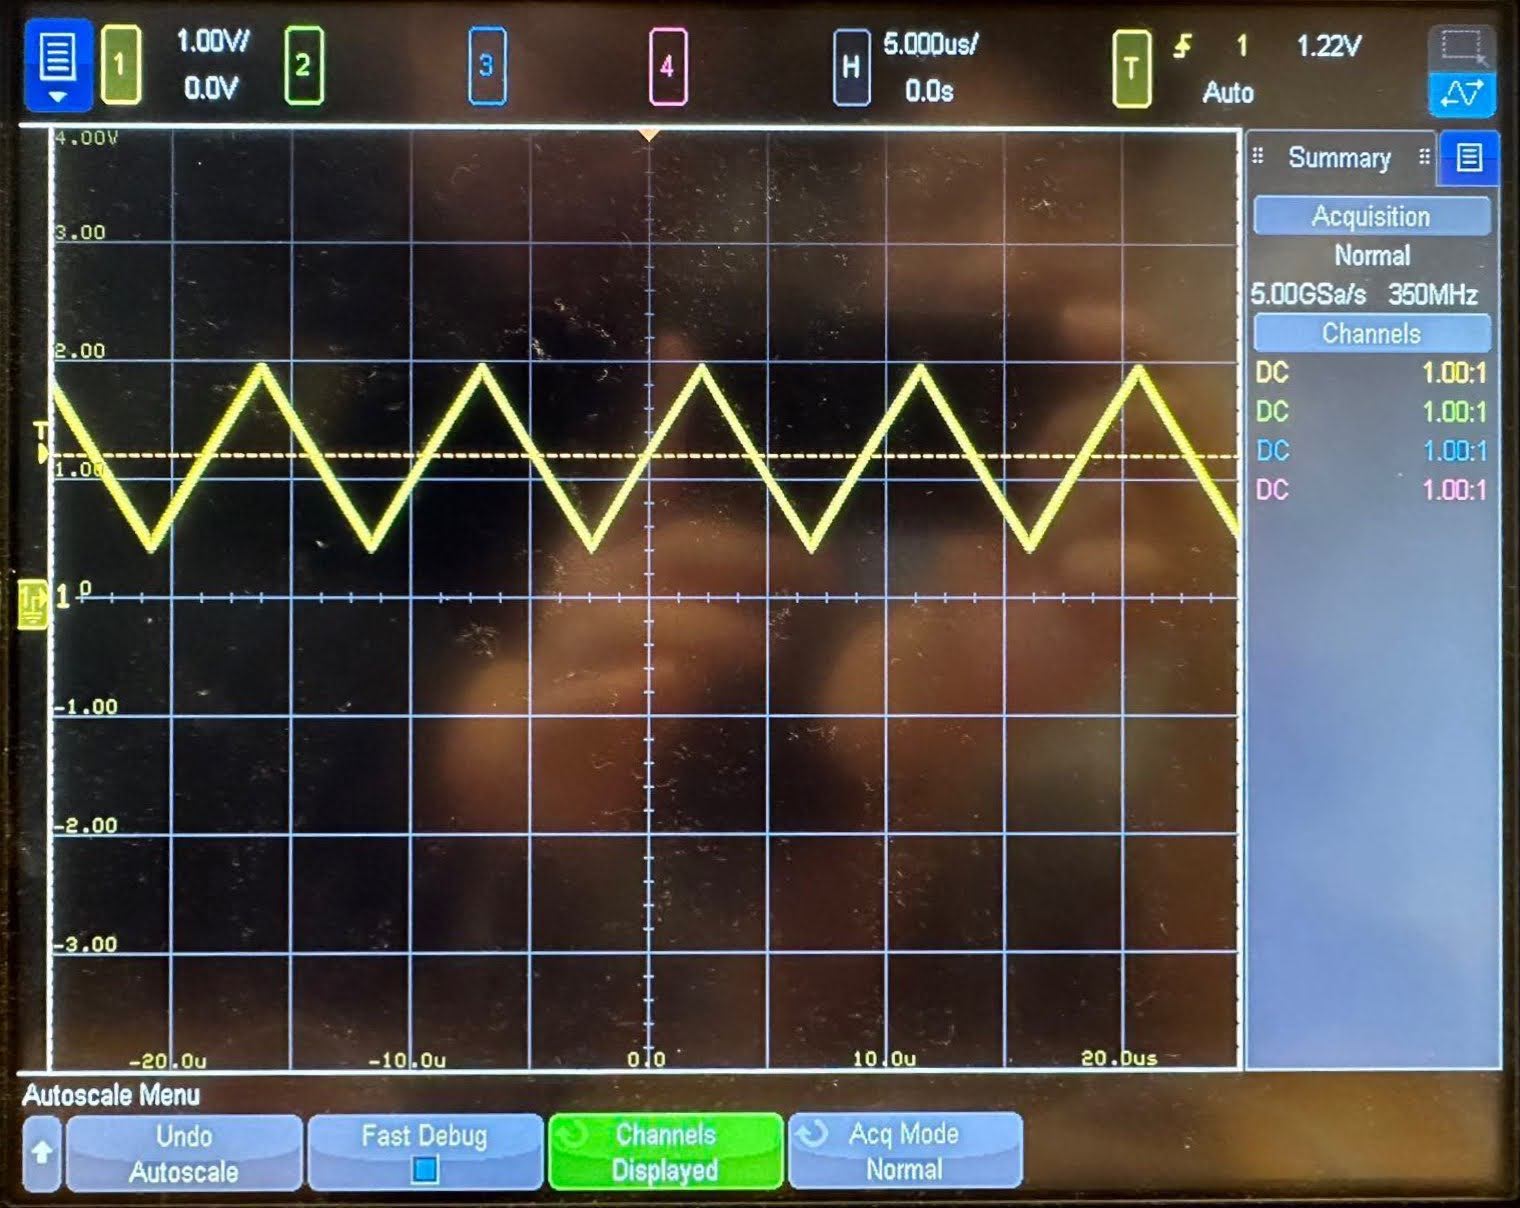
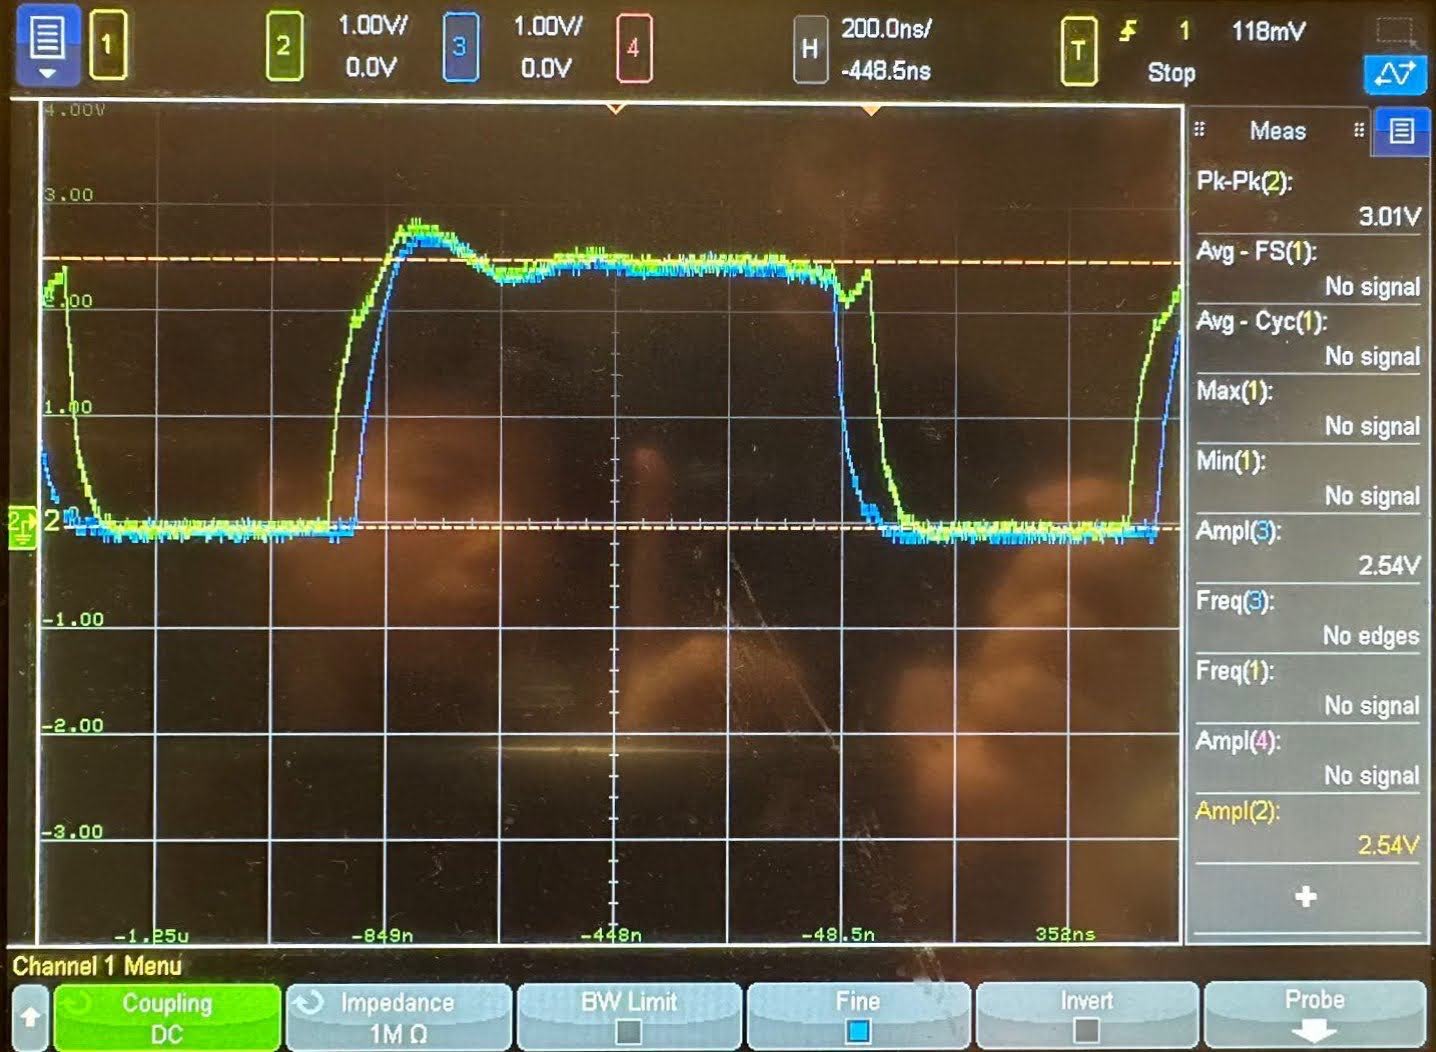
Figure 2 shows the function of the non-overlapping generator. we can adjust the dead time by screwing the potentiometer on the PCB. The dead time is set at 20ns.
The next graph demonstrates the generation of the PWM wave. The pink signal is the input sine wave, and the blue one is the triangle wave. The green wave is the clean PWM signal generated by the comparator.
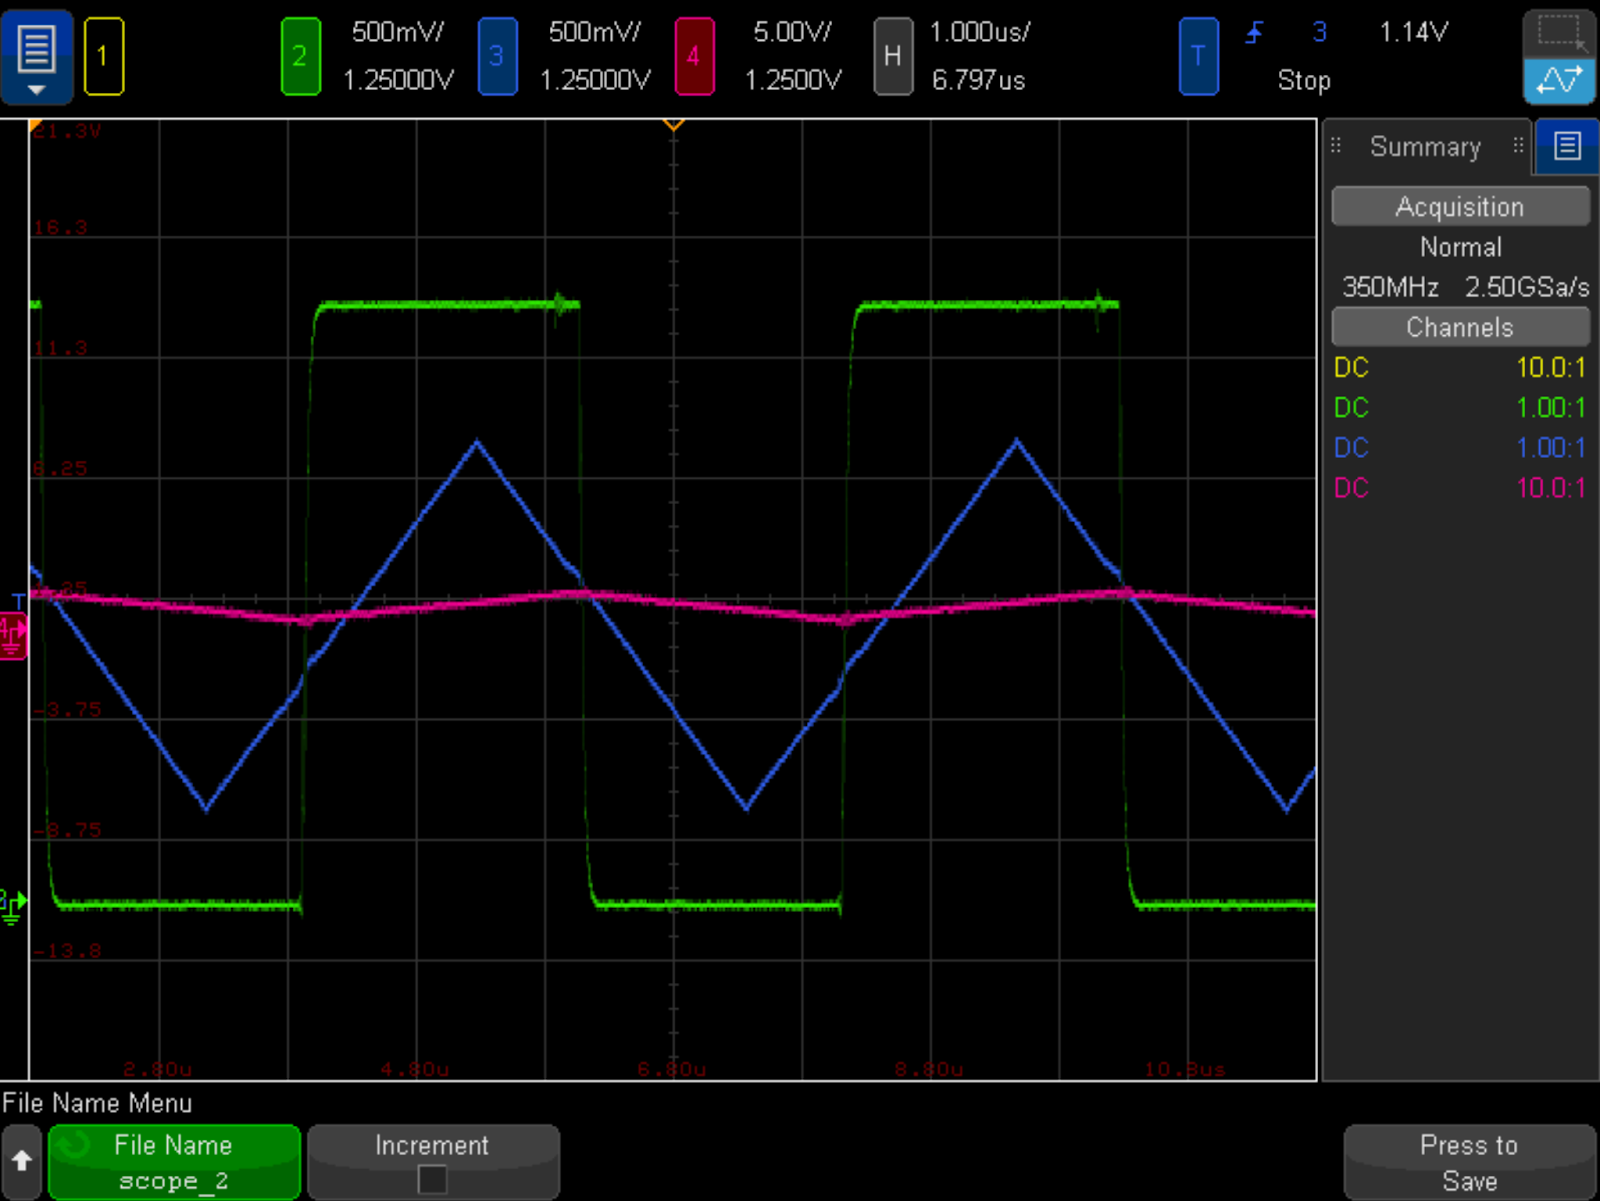
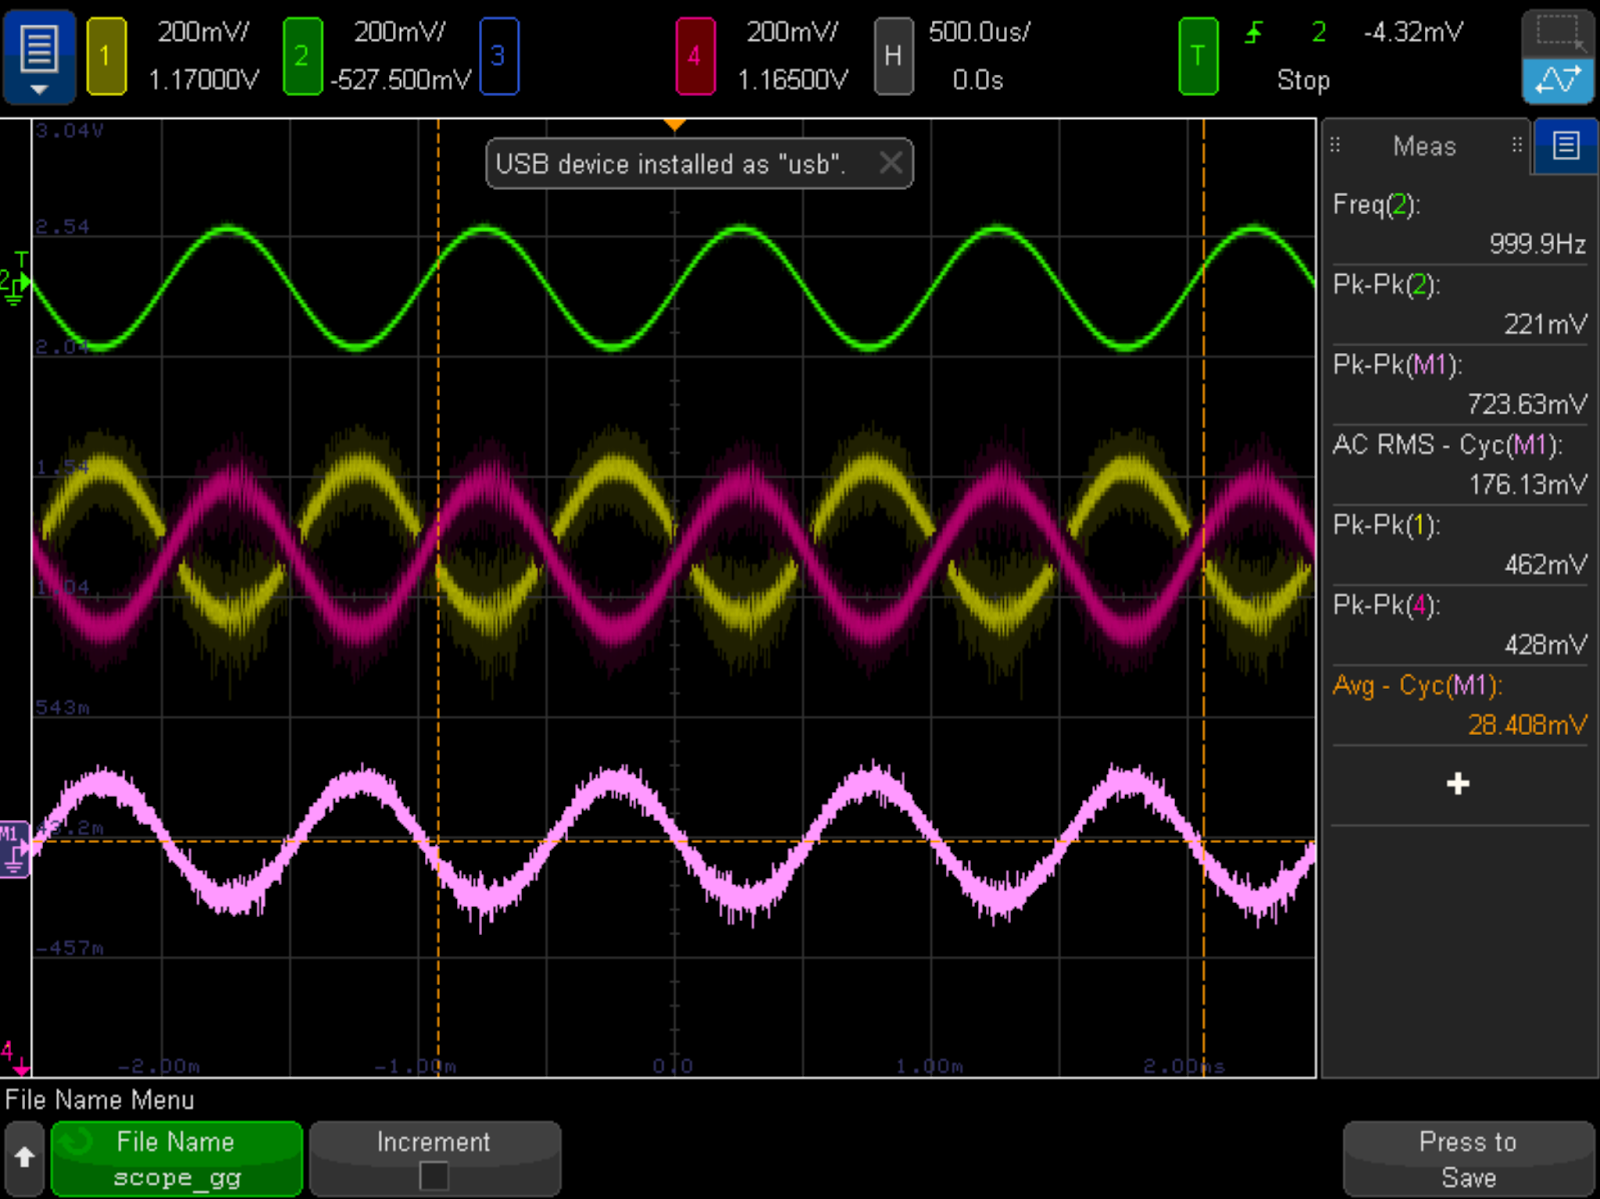
Figure 4 below shows the end-to-end testing results of the chip. The green wave represents the 1 kHz input signal with a peak-to-peak voltage of 200 mV. The middle two waves represent two differential output waveforms. The pink sine wave is the overall output signal which is used to drive the speaker.
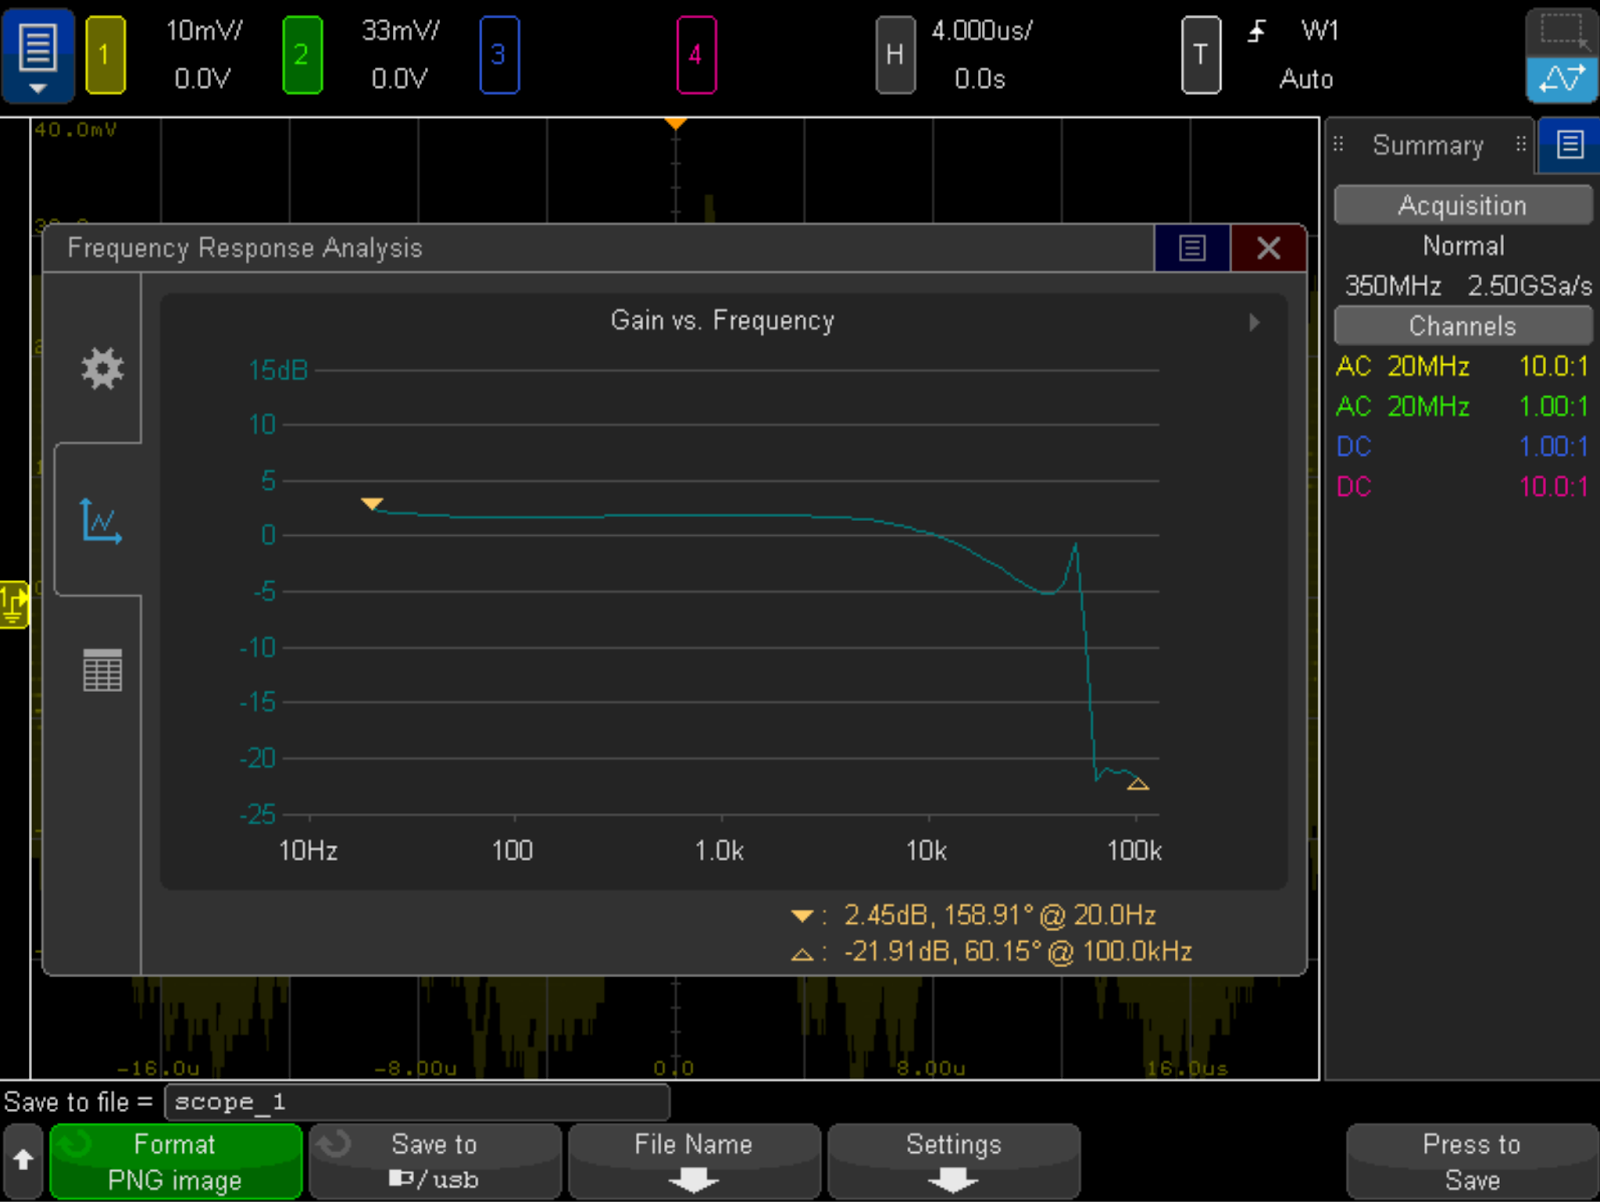
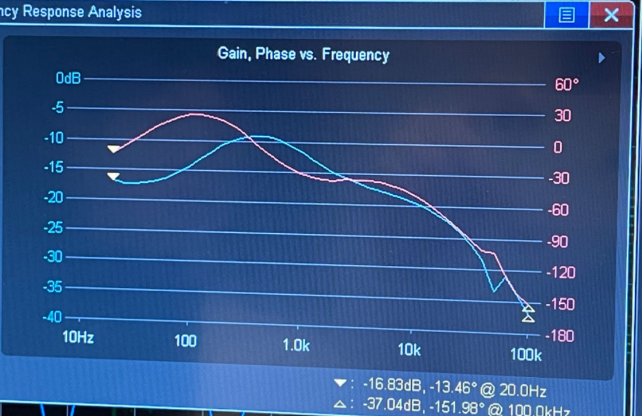
The frequency response was measured while bypassing the tone-control circuits. We got a flat response from 20 Hz up to 10 kHz. Ideally, the region should reach 20 kHz, which is the upper limit for the human ear. This could be caused by the limited bandwidth of the integrator and the LC filter.
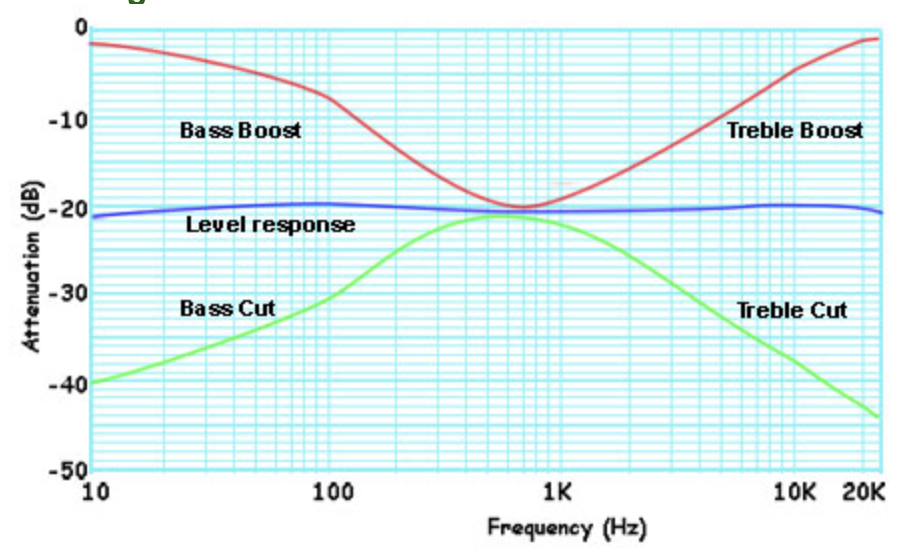
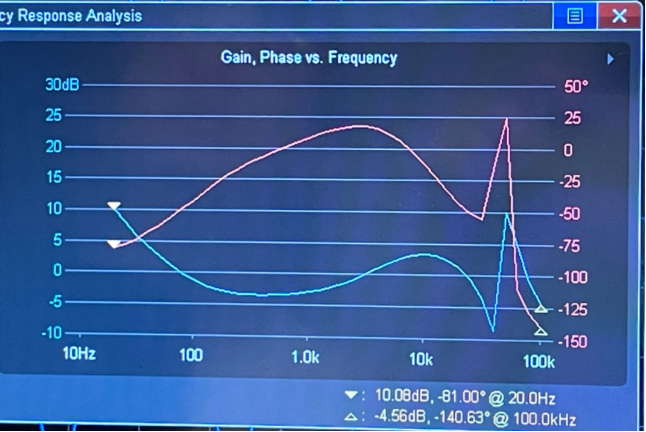
The tone control circuits work well. Our target is to tune the bass and treble parts of the music individually. Therefore, we can modify the texture of the music based on its genre. In Figure 8, both the bass and treble aspects of the music are boosted, and in Figure 9, both the bass and treble aspects are attenuated.
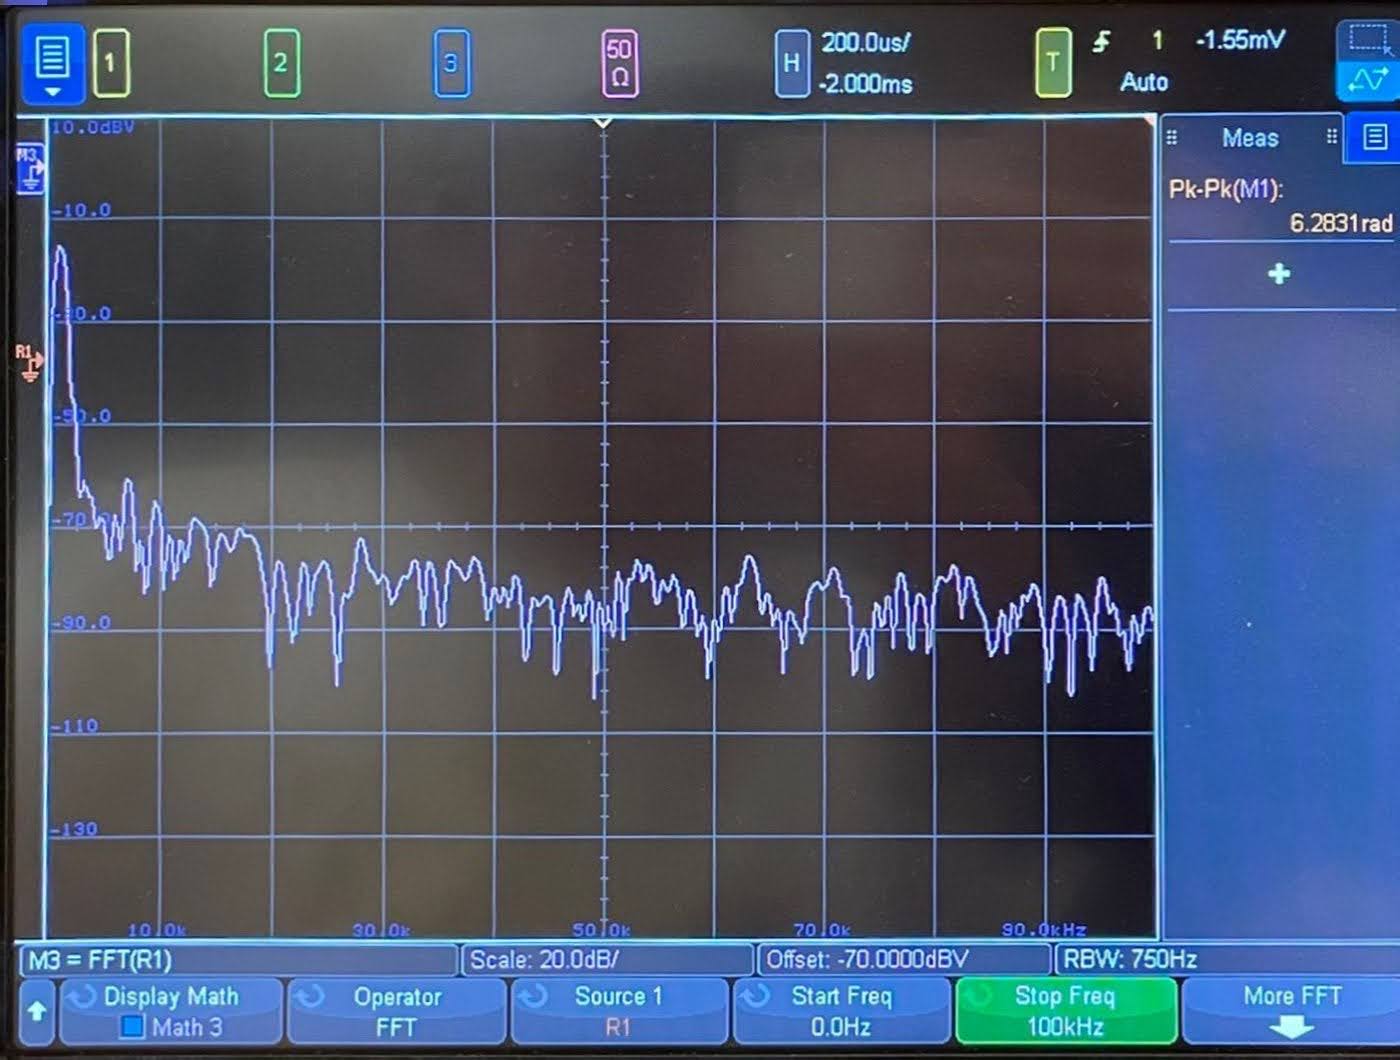
We also captured the spectrum of the differential output using the oscilloscope's FFT function. It is performed with a 1 kHz input signal. The THD was measured to be 1.5%.