
SYSTEM OVERVIEW
SYSTEM BLOCK DIAGRAM
Our goal is to design a heartbeat rate and blood oxygen saturation (SpO2) monitor. As can be seen in Fig. 3, the incoming power is controlled by the LDO (low-dropout) voltage regulator to be distributed throughout the PCB. The LEDs shine light into the finger tissue and the photodetector senses the small variations in intensity of light received. This information is fed into the chip as current, and the chip extracts diagnostic information by carrying out current-to-voltage conversion, filtering, amplification and noise reduction. The Arduino processes the output signal from the chip and displays heart rate and SpO2 concentration on a computer.
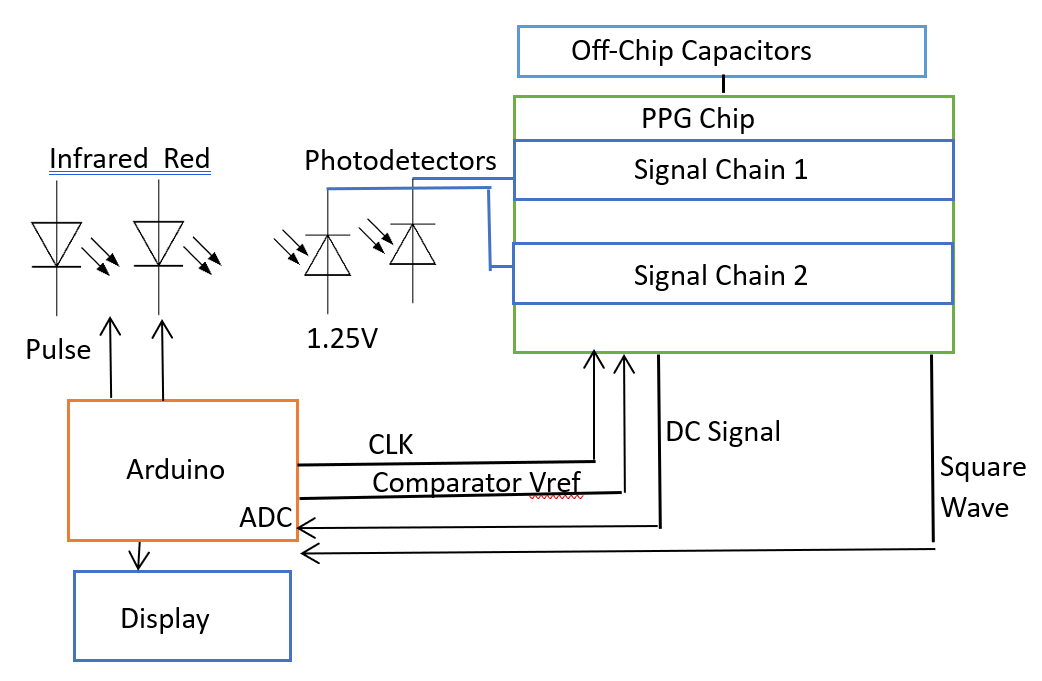
Fig 3. Diagram of Overall System
CHIP OVERVIEW
This section gives an explanation of the PPG technique and an overview of the chip's working principle. The light intensity captured by the photodiode is proportional to the change in blood volume, which is synchronous to the heart beat. As blood passes through the section of blood vessel during a cycle of heartbeat, the increase in blood volume causes more LED light to be absorbed, vice versa. Therefore, the heart rate can be obtained from the frequency of the AC component of LED light detected.
The oxygen saturation can be estimated by the percutaneous oxygen saturation (SpO2), which can be calculated with PPG by means of a rapid switching between red (∼660 nm) and IR (∼940 nm) light through vascular tissue. Oxyhaemoglobin absorbs less of the red light and more of the infrared, with the opposite being true for deoxy-haemoglobin. When light at these two wavelengths is emitted in the tissue, the difference in absorption can be exploited to estimate the quantity of oxy- and deoxy-haemoglobin. The AC and DC components of the photodiode current are extracted through a filter and amplification network, and passed to the ADC of Arduino for analysis.
Fig. 4 shows the block diagram of the PPG_O2 chip. The PPG signal received consists of a large DC component and a small AC component. The photodiode produces a current proportional to light intensity detected, and this current is converted to voltage through a TIA. A high pass filter is first used to filter out the large DC component. The resulting signal is then amplified through a 20dB OTA-based amplifier. Then it is passed through a bandpass filter to filter out the high frequency components and noise in the PPG signal. The signal is amplified again to the level compatible with the comparator design (~1 Vpp) by a PGA (programmable gain amplifier). It is passed through the comparator to obtain a square wave that can be processed by the Arduino microcontroller.
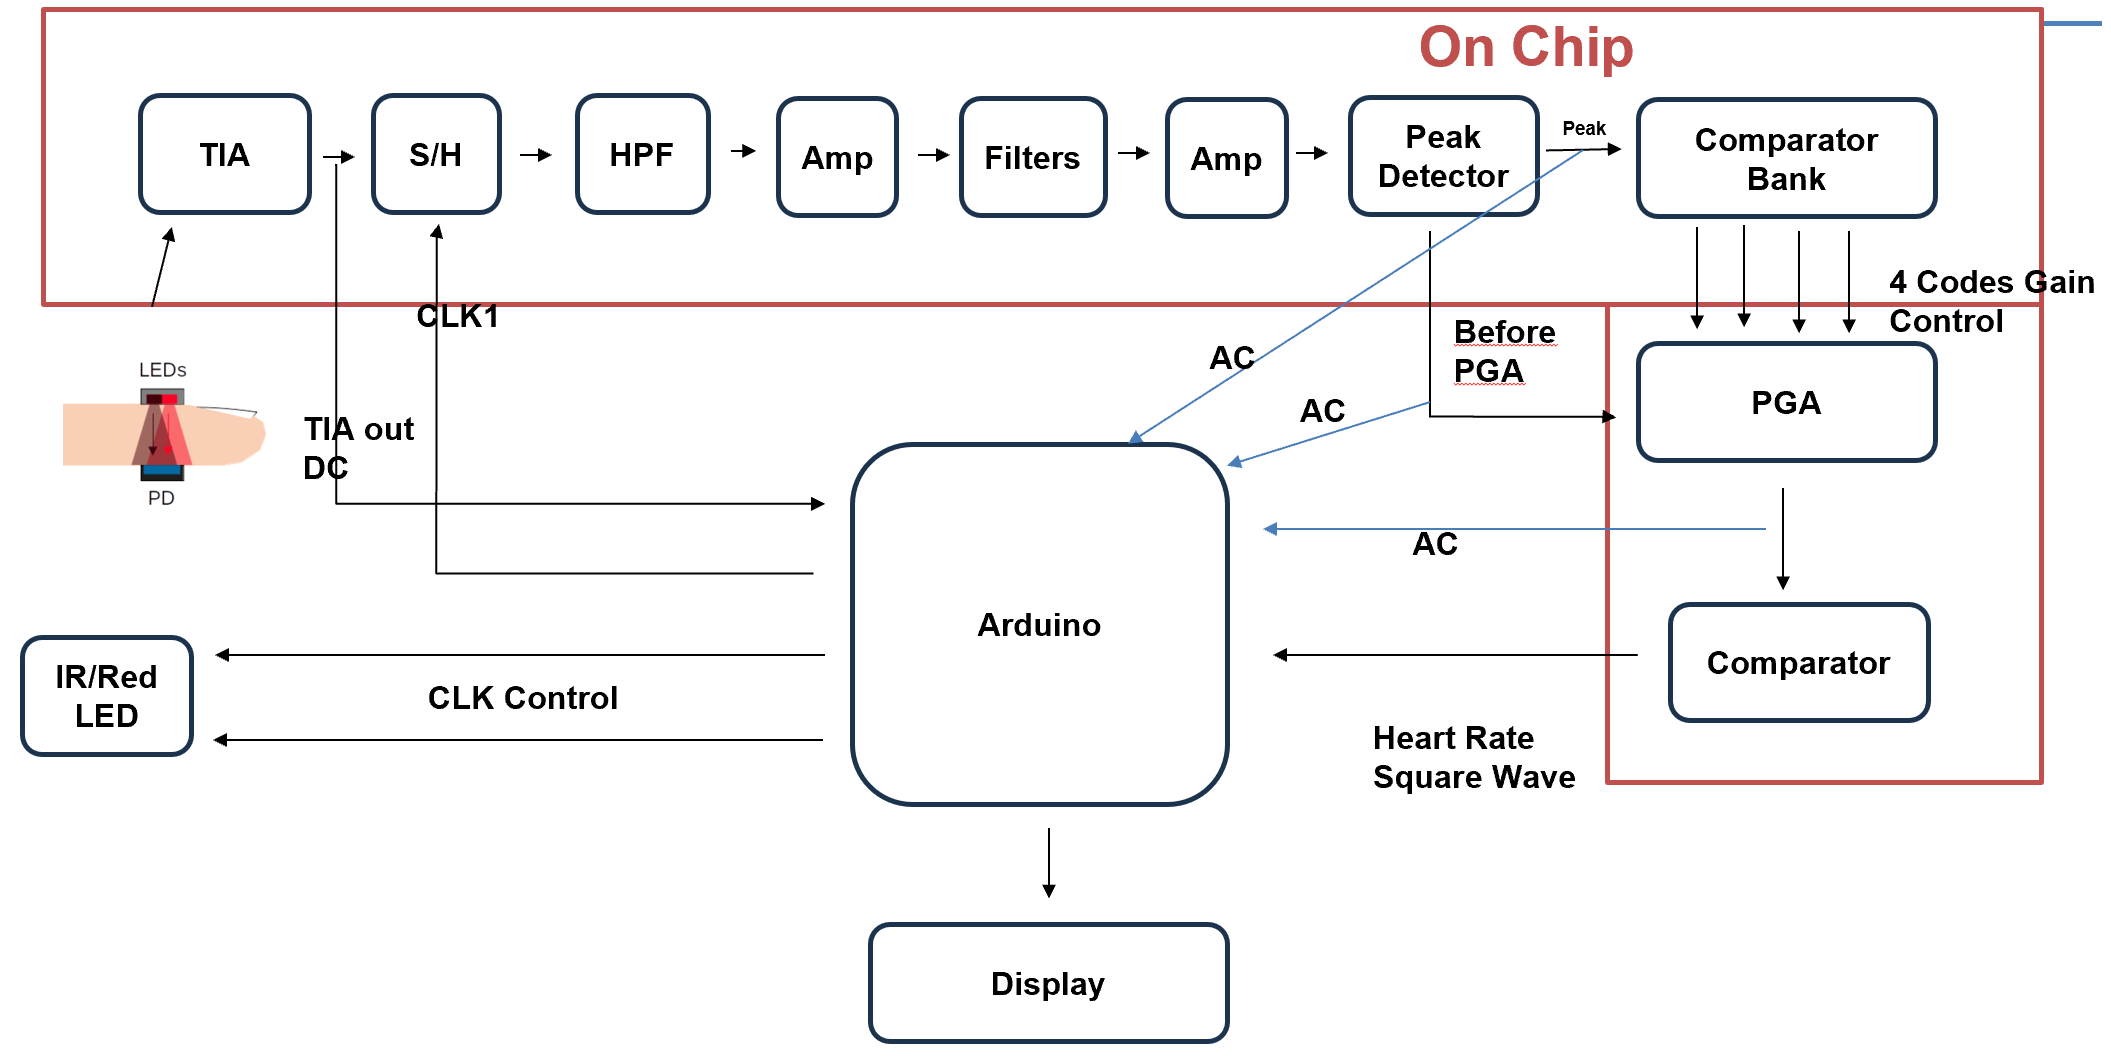
Fig 4. Block Diagram of Chip