
Testing
Gm Cell

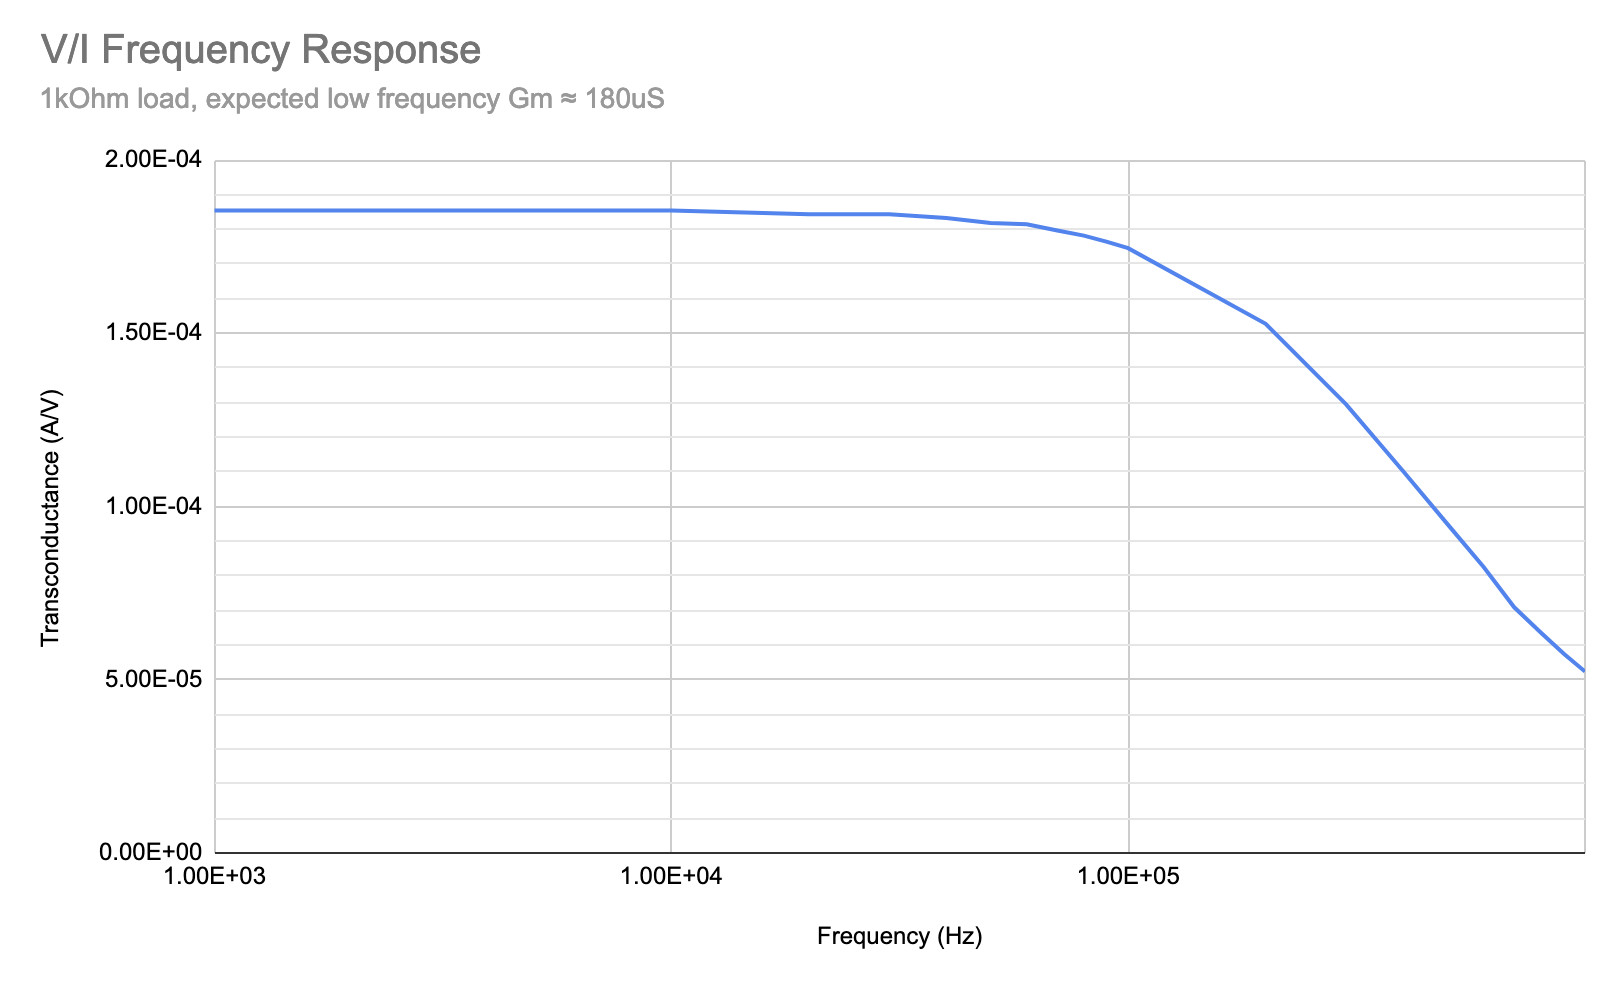
For this test, the Gm cell was used to inject a 1.5kHz AC current into an off-chip 1kOhm load. The input differential voltage was swept from 50mV to 950mV, corresponding to ~10uA to ~190uA current output. The non-zero output current at zero differential input voltage is due to slight mismatch between the differential pair; this can be calibrated out, and is thus not a significant issue.
A separate test was conducted to measure the harmonic distortion of the Gm cell. With a 10kOhm load, 1.5kHz 52uA output current, all harmonics were measured to be 65dB below the carrier.
The above measurements and the below frequency response match well with the simulated Gm cell results.
LNA
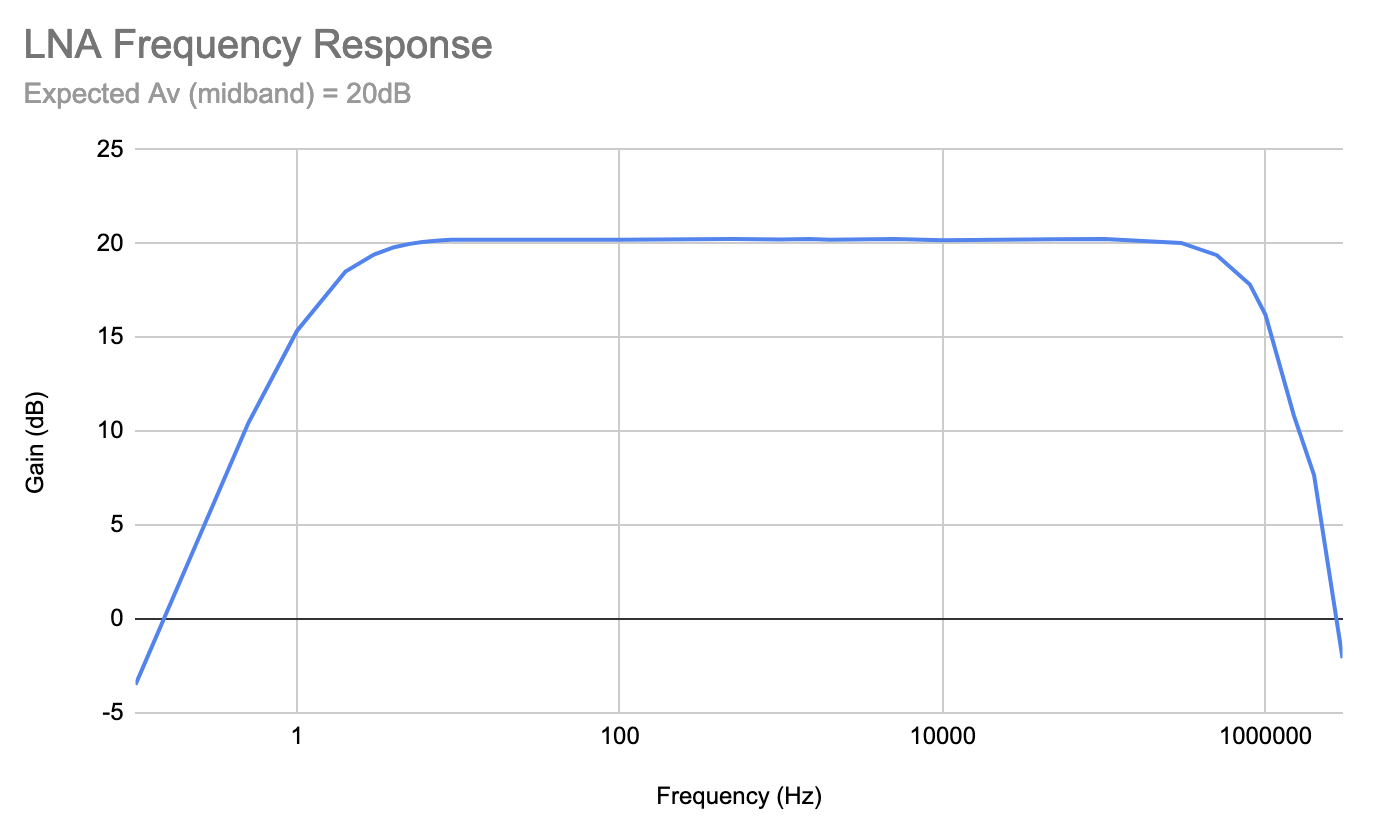
The LNA frequency response shows the high pass corner (~2Hz), set the by the feedback pseduoresistor and feedback capacitor, the midband gain of 20dB, and the low pass corner. The measured corners and midband gain match well with simulations.
PGA
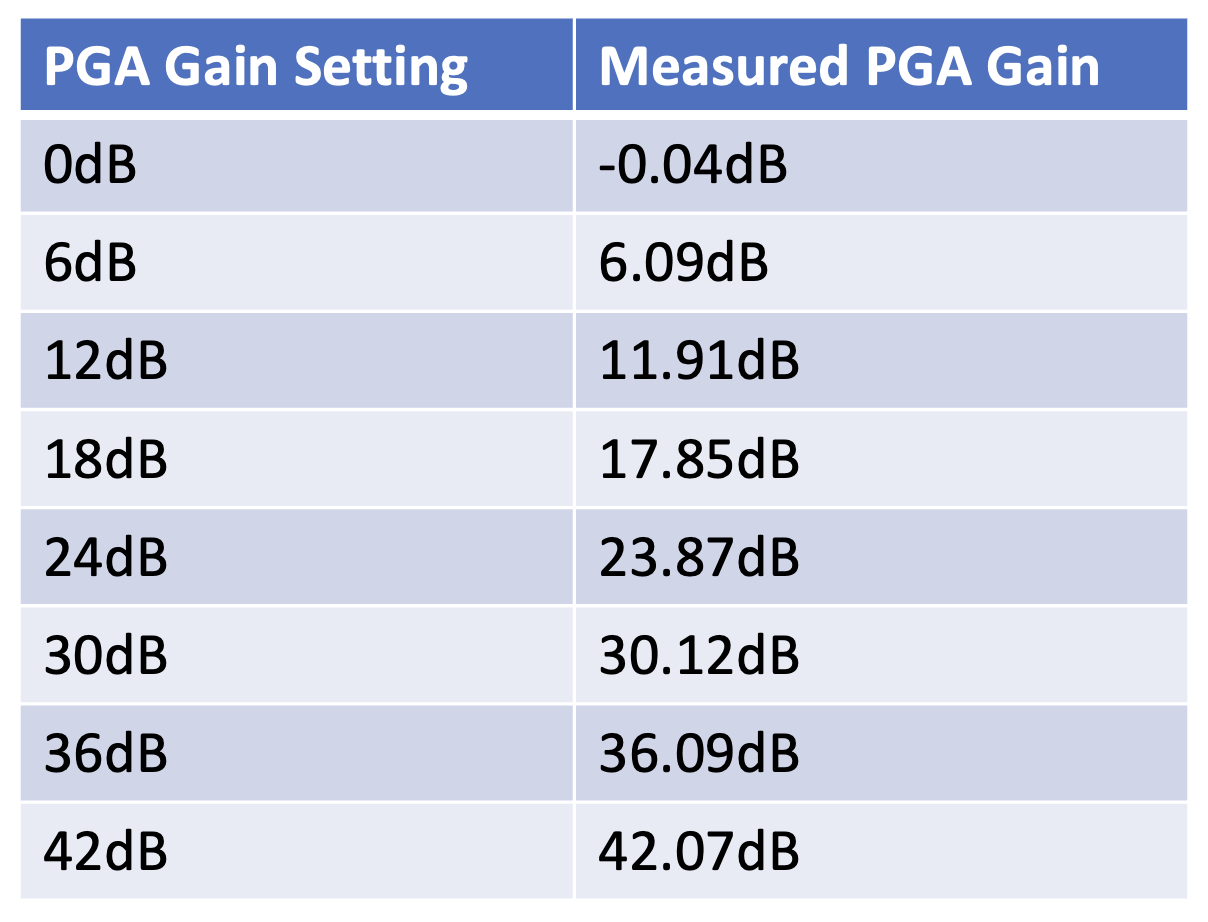
The PGA gain was measured at 1.5kHz for each of the gain settings. During testing, non-linearity was observed at large output voltages and high frequencies. This is due to power bandwidth limitations. This limtation is only seen in frequencies much larger than the frequencies used for EIT, thus it is not an issue.
Mixer & Functional Validation
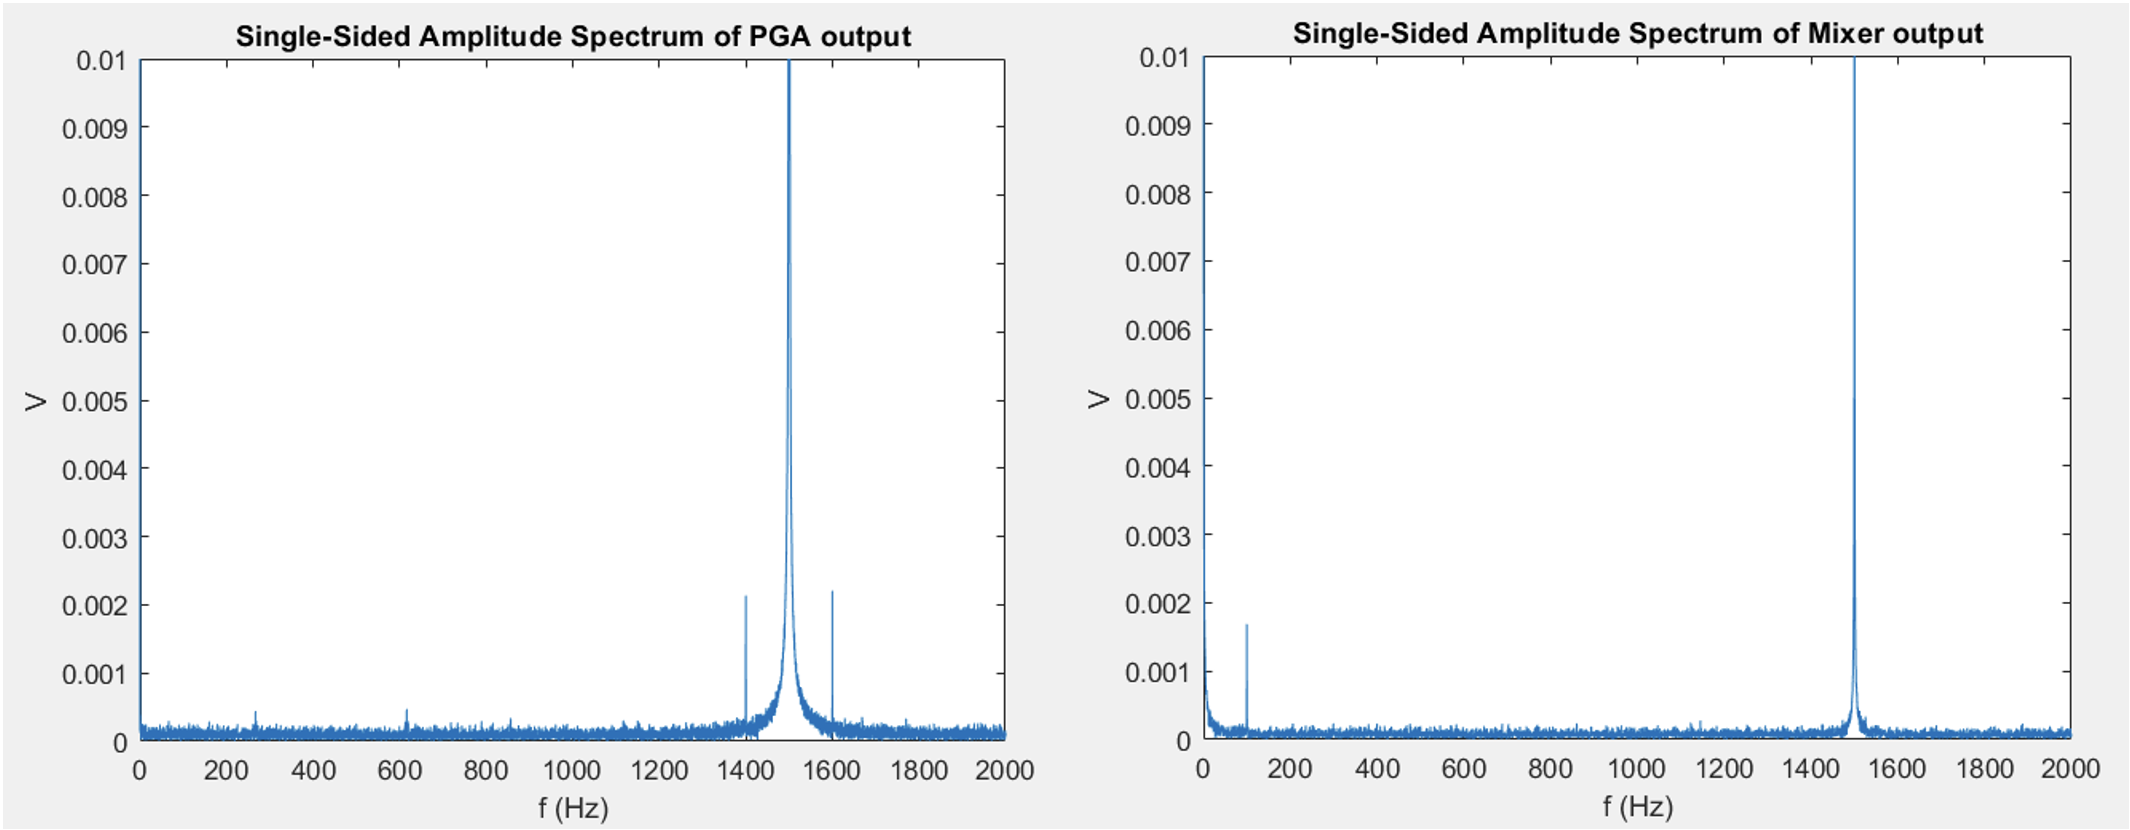
Mixer and PGA output FFT (after filtering and sampling)
In this test, to model a typical EIT signal, a 1% amplitude modulated (12mVpp 1.5kHz carrier, 100Hz AM) signal was supplied at the LNA input. The output data from both the PGA and the mixer, after filtering and digitization, was sent to MATLAB for processing. The FFT of the PGA output shows the carrier at 1.5kHz and the 100Hz amplitude modulation as peaks at 1.4kHz and 1.6kHz. This data is then mixed with a 1.5kHz square wave, which should bring the modulation signal down to 1.6kHz - 1.5kHz = 100Hz. This 100Hz peak can be seen in the FFT of the mixer output, demonstrating accurate frequency mixing.
This test, which shows that a 1% modulation depth can be accurately recorded by the ASIC, serves to verify the functionality of the device in its intended operation. The ASIC would be capable of recording a similar signal that modulates the carrier by 1% from the biological sample, as it is capable of recording a synthetic modulation of the same depth.