
System Overview
In this project, we use the Nellcor Oximax sensor to collect PPG signals from the user. This sensor is built as a clip and is of a transmission type sensing, which places light source on one side of the clip, lets the light travel through the user’s fingertip, and collects the transmitted light signal on the other side with a phototransistor. While the sensor contains both a red LED and an infrared LED, we use the infrared one only since it penetrates human tissues better. The sensor outputs the PPG signal in the form of current through the phototransistor, and we take the voltage from the drain-equivalent node of the phototransistor to serve as the input to our IC.
The PPG current signal contains both AC and DC components. The DC component is proportional to tissue parameters such as composition and thickness, which do not contain useful information for our system. The AC component is mainly caused by pulsatile changes in arterial blood volume, which is synchronous with the heartbeat and thus useful for our system. Since the AC component only takes a small fraction of the entire signal, the IC must include high-gain, low-noise amplifiers in order to extract the useful information. We also decided to include an on-chip comparator, whose square-wave output makes it convenient for a downstream microcontroller to process and analyze.

Figure 2. System architecture
As shown in figure 2, the IC consists of three stages. The signals from the sensor pass through two stages of amplification, before being converted to digital signals in the comparator stage. The square waveforms will then be the input to an Arduino microcontroller, who will process the information and display the user’s heart rate on a LCD screen.
Since the signal acquired by the Oximax sensor contains noises of varying frequencies, we also insert analog filters in and between the stages to reduce these noises. We expect a normal heart to beat between 30 to 240 times per minute, corresponding to 0.5 to 4Hz, which is then our frequency window of interest. We also expect breathing activity (0.2 to 0.4Hz) and motion-related noise components (both low and high frequency) to be present in the signal. Therefore, we need high-pass filters with cut-off frequency around 0.5Hz and low-pass filters with cut-off frequency around 4Hz to retain our desired signals only. The systems parameters such as amplifier gain, comparator threshold, and system bandwidth are determined based on the Oximax sensor signals alone, and may need to be altered to accommodate signals acquired from other devices. Figure 3 shows the system level circuitry for the heart rate monitor. Note that the current supply on the top left does not reflect how the actual system is set up, since in the actual system we use the voltage supply and a series resistor to create the bias current for each module.
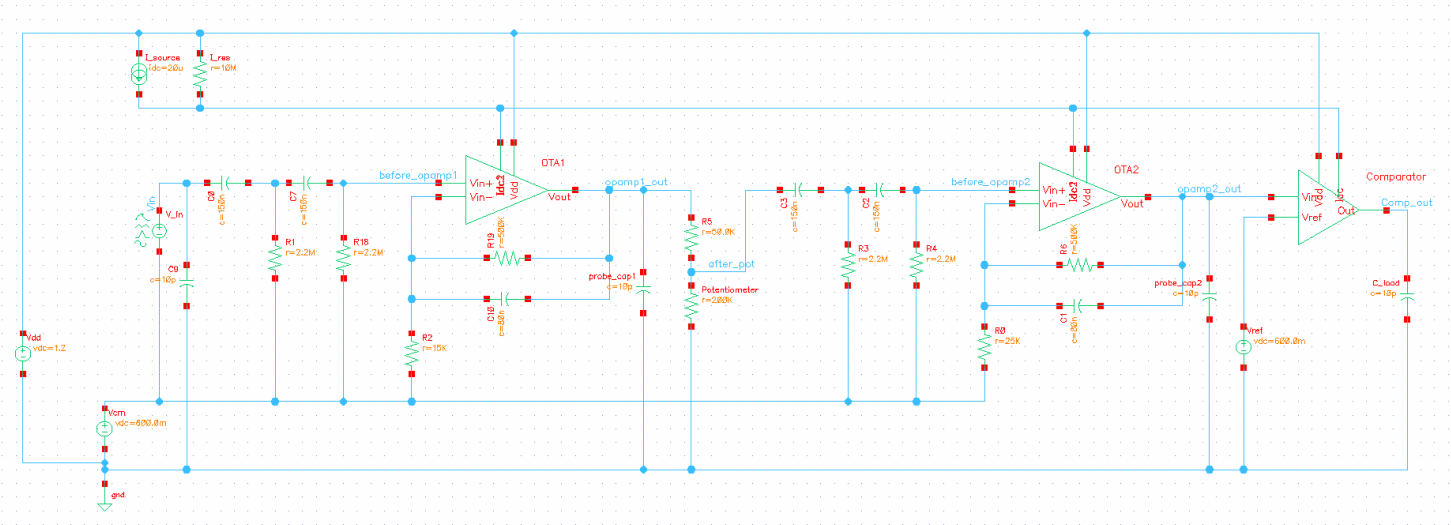
Figure 3. System level circuitry
In figure 4, we show the simulation results after each stage to demonstrate the function of each block. The input signal on the top row was acquired from an actual user’s fingertip, collected from Oximax Sensor, and imported to Cadence for simulation. The second to the sixth rows respectively show output of first OTA output, voltage after potentiometer adjustment, second OTA input, second OTA’s output, and comparator output. Notice that the second OTA output is considerably cleaner than the first OTA output, which is why we decide to include two stages of amplification.
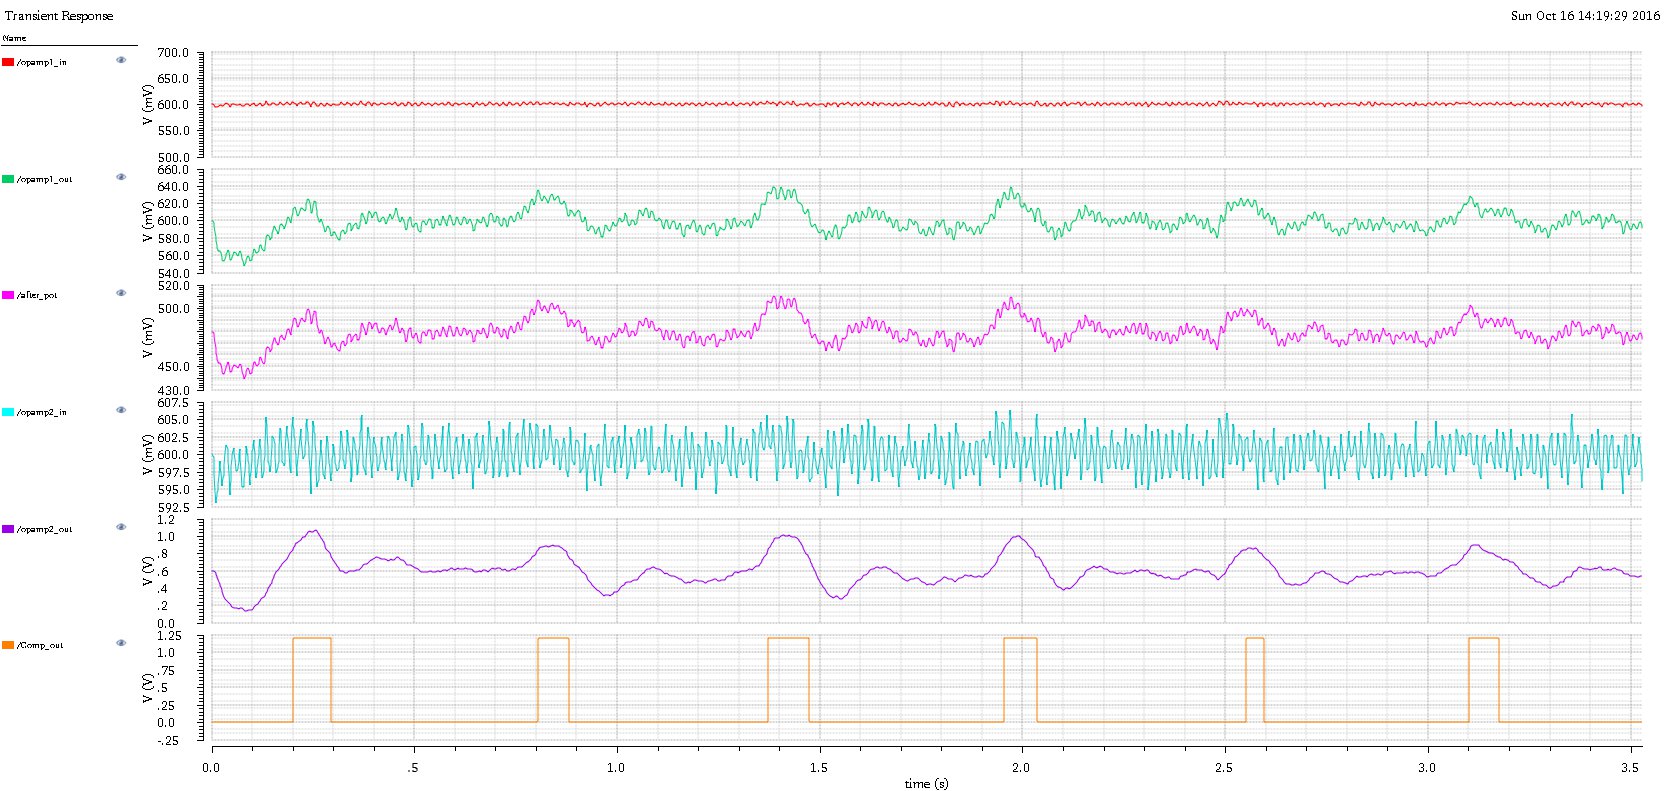
Figure 4. System simulation result