
TESTING
The initial motive of testing included:
1. If the error amplifiers in PTAT and BGR circuit were working
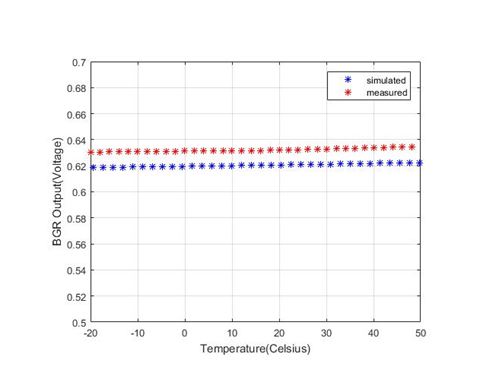
2. If BGR produced constant voltage across all temperatures
3. If PTAT voltage increased or decreased with temperature
4. If the non-inverting amplifier amplified the signals proportionally
After assembling the chip on PCB, a variation in temperature is created by either blowing hot air at the IC or by placing cold objects closer to the IC. During the intial measurements, we found out that the output from PTAT circuit was producing an offset of 200 mV because of which the amplified output was saturated. Thus we decided to tap the PTAT output directly and connect it to arduino for programming as we obtained a good enough range of voltage from -20 to 50 deg C for better resolution.
After these initial trials we used a temperature chamber to measure the output PTAT voltage across the temperature set by the chamber. We performed the experiment over temperatures between the range of -20 to 50 degree Celsius in steps of 5 degrees and 2 degrees.
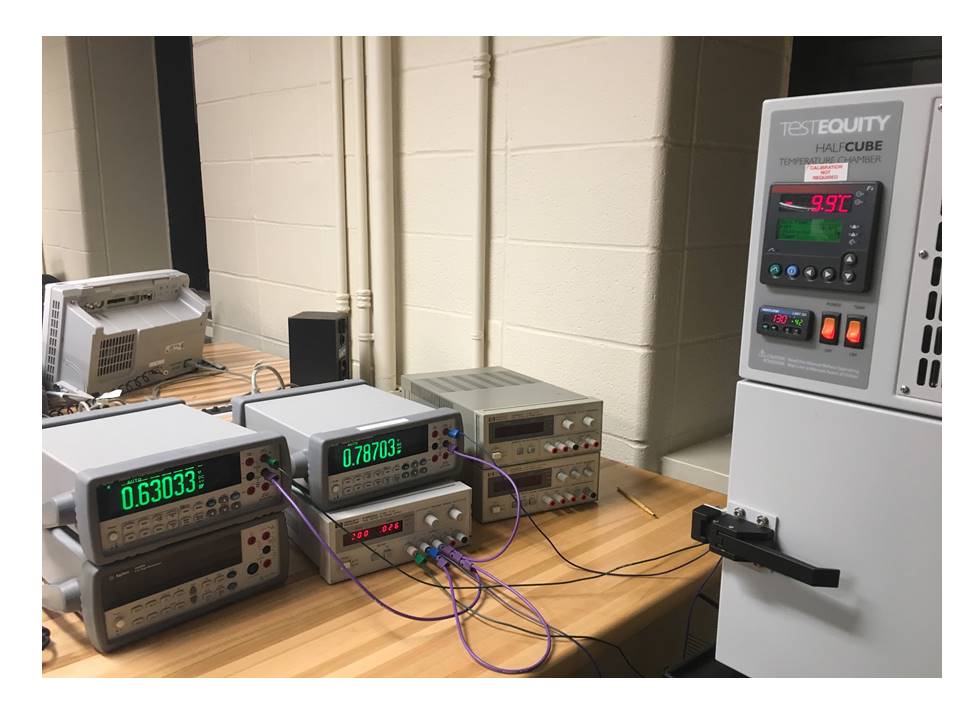
The PTAT output is then fed to the analog pin of the arduino to display the temperature in Celsius and Fahrenheit scale .
Measurements: From the testing we concluded that, the temperature sensor gives a reading upto +/- 2 deg C above the room temperature to 50 deg C and +/- 3 deg C below the room temperature to -20 deg C. The reference voltage accuracy is +/- 2 mV through the temperature range. The error amplifier shows equal reading of voltages at its two input nodes with, +/- 1 mV difference between them.
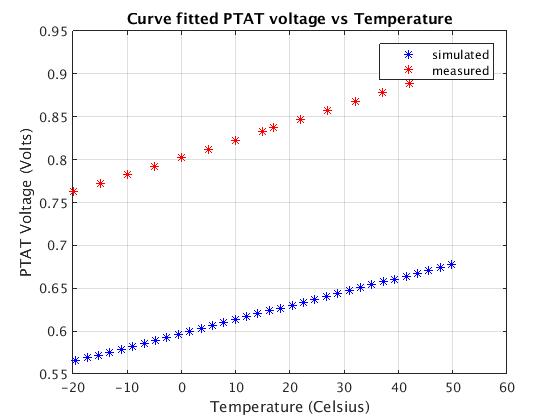
According to the Monte Carlo simulation we are expecting a 3 sigma variation of 230.3mV for our PTAT circuit. Our measured PTAT output value falls in the same range.
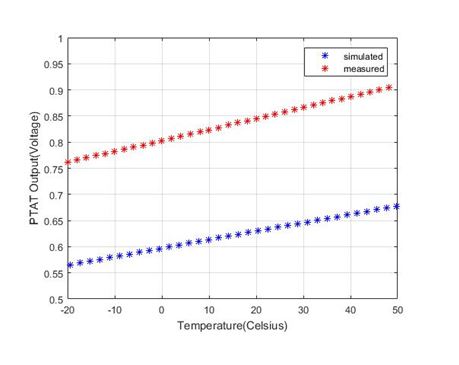
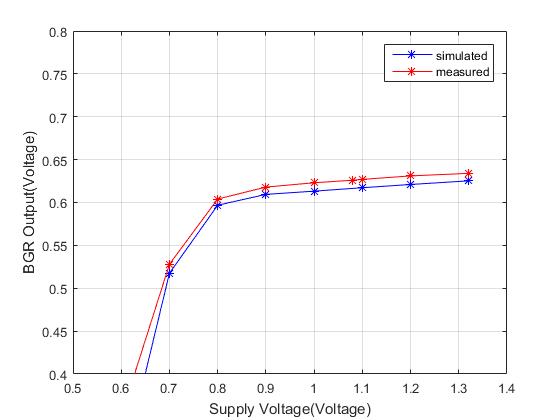
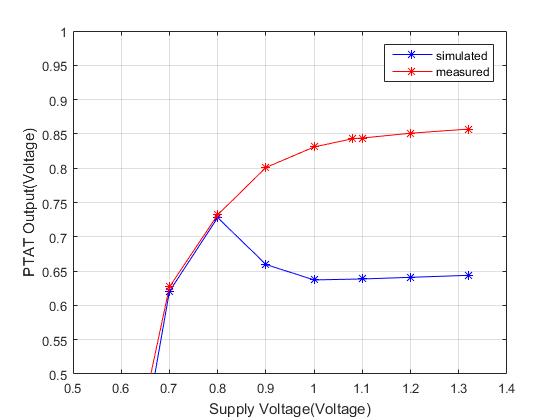
Figure 29 and 30 show the plots of BGR and PTAT outputs respectively varying across supply voltage. From these, we can conclude that both the simulated and the measured results behave similarly but with a 3 sigma variation as expected from our Monte Carlo simulations.
| Specification | Simulation | Measurement |
|---|---|---|
| VPTAT (at room temperature) | 0.634V | 0.848V |
| VIP_PTAT (at room temperature) | 0.8066V | 0.8204V |
| VIN_PTAT (at room temperature) | 0.8062V | 0.8206V |
| VREF (at room temperature) | 0.620V | 0.632V |
| VIP_BGR (at room temperature) | 0.7644V | 0.7841 |
| VIN_BGR (at room temperature) | 0.7647V | 0.7843 |
| Temperature Coefficient (at room temperature) | 1.8mV/C | 2.1mV/C |
| Current Consumption (at room temperature) | 140uA | 200uA |
| Temperature Range | -20C - 50 C | -20C - 50 C |
Table 2: Simulation vs Post Silicon measurements