
Testing
Testing was performed by using the apparatus shown in Figure 1. Dynamic Range was calculated as the linear region of the intensity vs. frequency plot.
Test Diagram
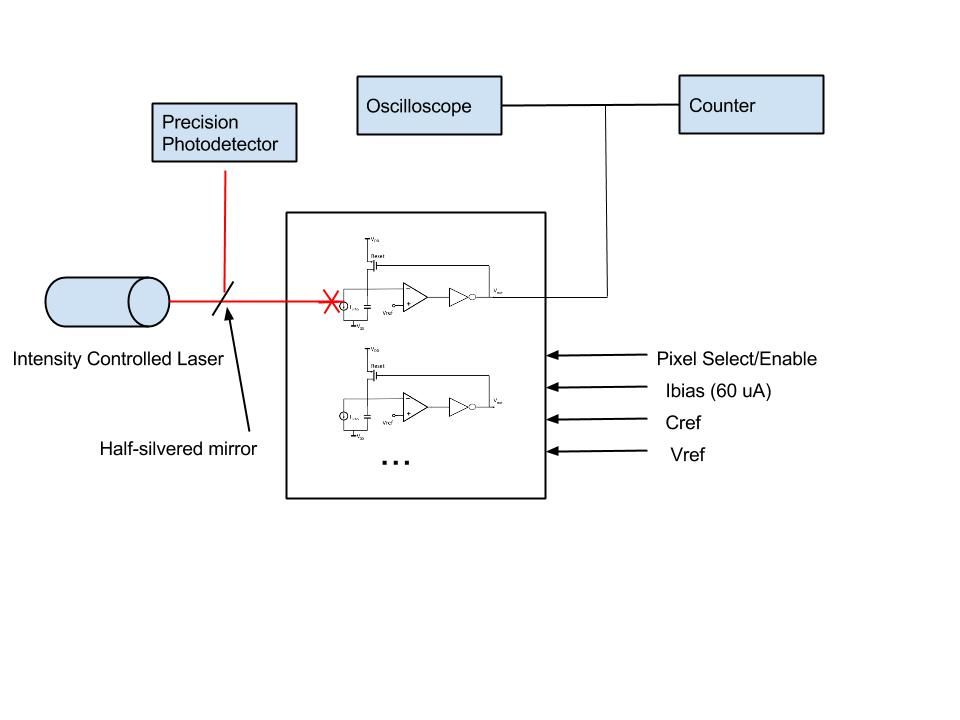

Testing was performed by using the apparatus shown in Figure 1. Dynamic Range was calculated as the linear region of the intensity vs. frequency plot.