Testing
With the DM6350 chip and the PCB in hand, the testing procedures started.
First the bonding wires from the die to the IC
package as well as the power supply vias on
the PCB were verified. Then an extensive
verification on the bias voltages of the circuit was completed. Finally the
functional tests were done, initially with a
signal generator generating the input signals and
later with the actual transducers.
Grounding the inputs, the DC level at the output of the LNA, the mixer, the
filter, and the comparator were measured and analyzed. The DC level at the
end of the LNA is set by a DC feedback, in order to match the currents of the
two current sources. As long as all the transistors on the current sources were
in the proper operating region, the DC tracked the external DC voltage. For
the mixer, the DC voltage depends on the current source at the tail of the
Gilbert cell and the value of the resistance. Pushing a current of 20uA at each
branch and placing 40KOhms resistors a common mode voltage of 1V is
expected at the output. This same voltage, in addition to a systematic offset
by the OpAmp, should also be the output of the filter. Both results were
confirmed on the test bench. The output of the
comparator is 5V in the
absence of a signal.
The next step was to analyze the waveforms at the end of each of the blocks
with the presence of an input signal. Applying a 1mVpp 40KHz sinusoids
modulated with a much lower frequency square wave the behavior of each
step of the receiver could be observed.
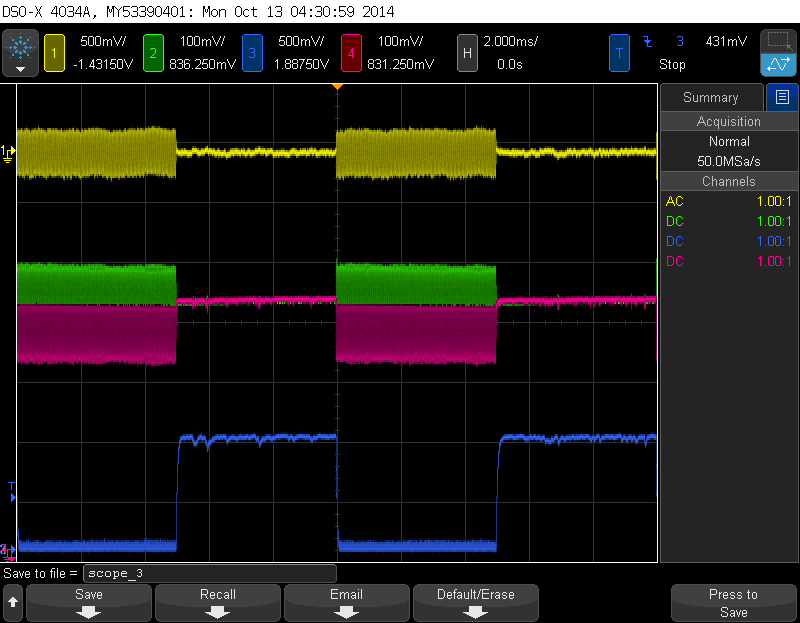
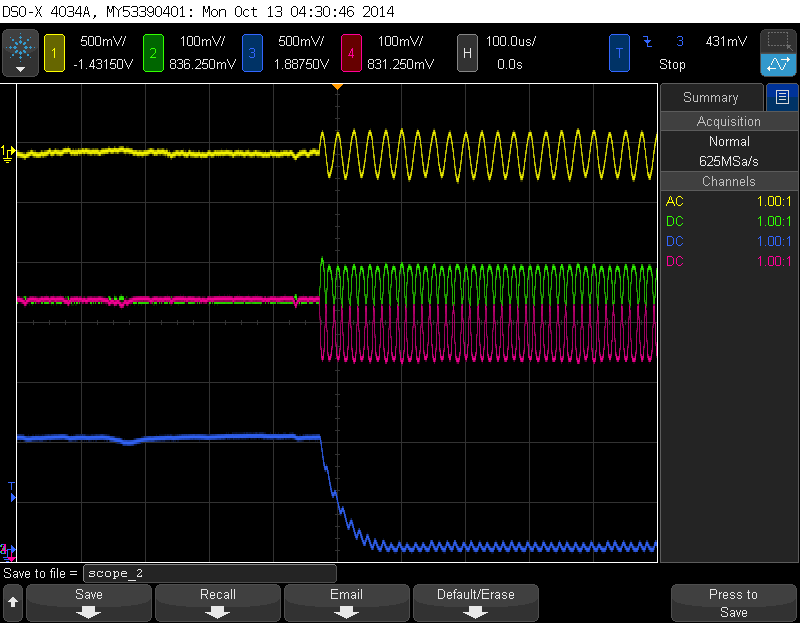
In the figure above, the first signal in yellow is the output of the LNA. With a gain of 55dB, it is an amplified version of the input. The green and pink signal are the differential outputs of the mixer; note in figure 15 that the frequency has doubled and the DC offset is present. At the bottom, in blue, is the output of the filter.
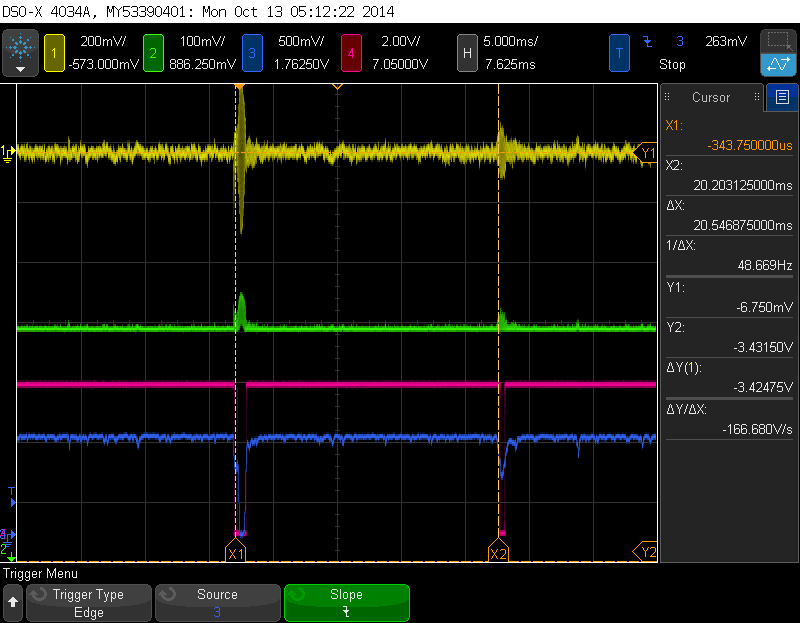
Finally the transducers were connected to test the complete system. The signal remains the same (yellow for the LNA, green for the Mixer, blue for the Filter), but now the pink signal represents the output of the comparator.
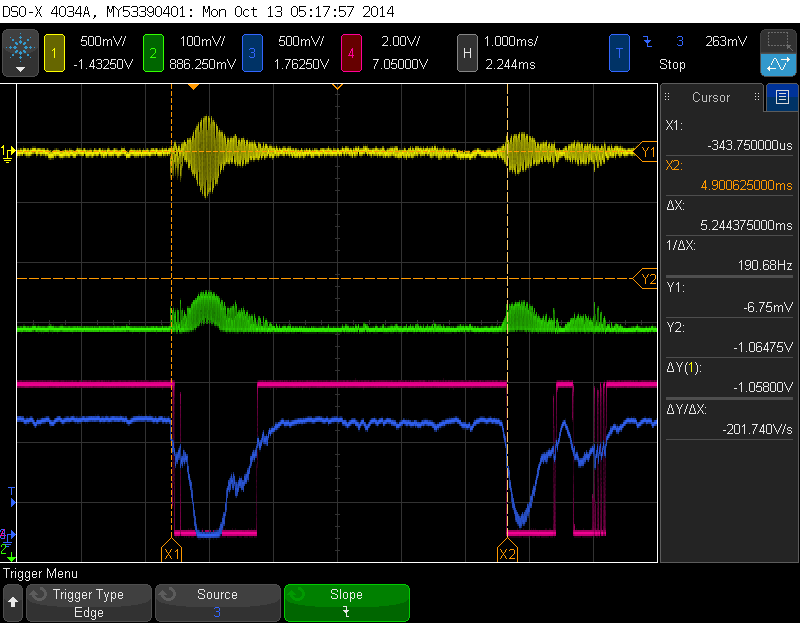
The very first burst observed at the LNA happens almost exactly when the TX transducer is activated.
This is expected due to the proximity of the transducers and the mechanical coupling that they have.
While the system is still detecting this first burst (while the pink signal still down), the sensor cannot respond
to anything else. This creates a dead time (Tdead) that is disregarded by the microcontroller,
limiting the minimal distance that the sensor can measure.
This Tdead depends on how much of the TX transducer signal is coupled into the RX transducer and on the threshold of the comparator.
Small threshold values will result in larger dead times.
From the measurements this time can vary from 1ms to 1.5ms, leading to minimum distance (Dmin) from 8 to 12 inches.
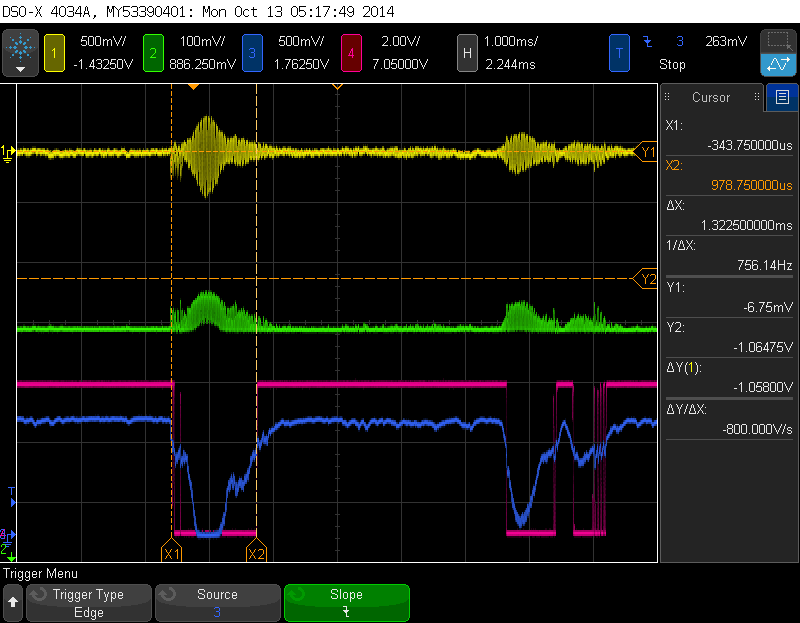
The maximum distance measured (Dmax) depends on the threshold value of the comparator, but, when the threshold is too low, random
noise at the output can trigger false measurements.
The maximum stable distance measured was 200 inches.
Note that there is a tradeoff in the threshold selection, a large threshold value reduces the Dmin, and while a small threshold value will increase the range of the sensor.
But we know when each of the options is more suitable.
At the vicinity of the first burst sent by the TX transducer, it would be better to have a large threshold value.
But as time passes without an response, weaker signals are expected, hence we should lower the threshold.
A possible future improvement for this design is
to use an adaptive threshold value.