Testing
PROCESS CORNER
Transistor performance and, as a result, system performance can be significantly affected by variations during the manufacturing process. Therefore, it is necessary to know if the devices on the chip being tested are typical, slow or fast. One way to determine this is to measure the I-V curves for transistors of known sizes on the chip. On our chip, we placed a test NFET on one of the control pins and used this and a PFET being used as a bias transistor to obtain the required I-V curves. By comparing our measurements with simulations, we determined that the chip being tested belonged to the SS (slow-slow) process corner.
TYPICAL OPERATION
The triangle wave generator on the chip was designed to produce a triangle wave with a frequency of approximately 500kHz and a peak-to-peak amplitude of 0.6 V. The option to supply an external triangle wave was also incorporated into the chip. Figure 2 shows a plot of the triangle wave generated on the chip as measured using an oscilloscope.
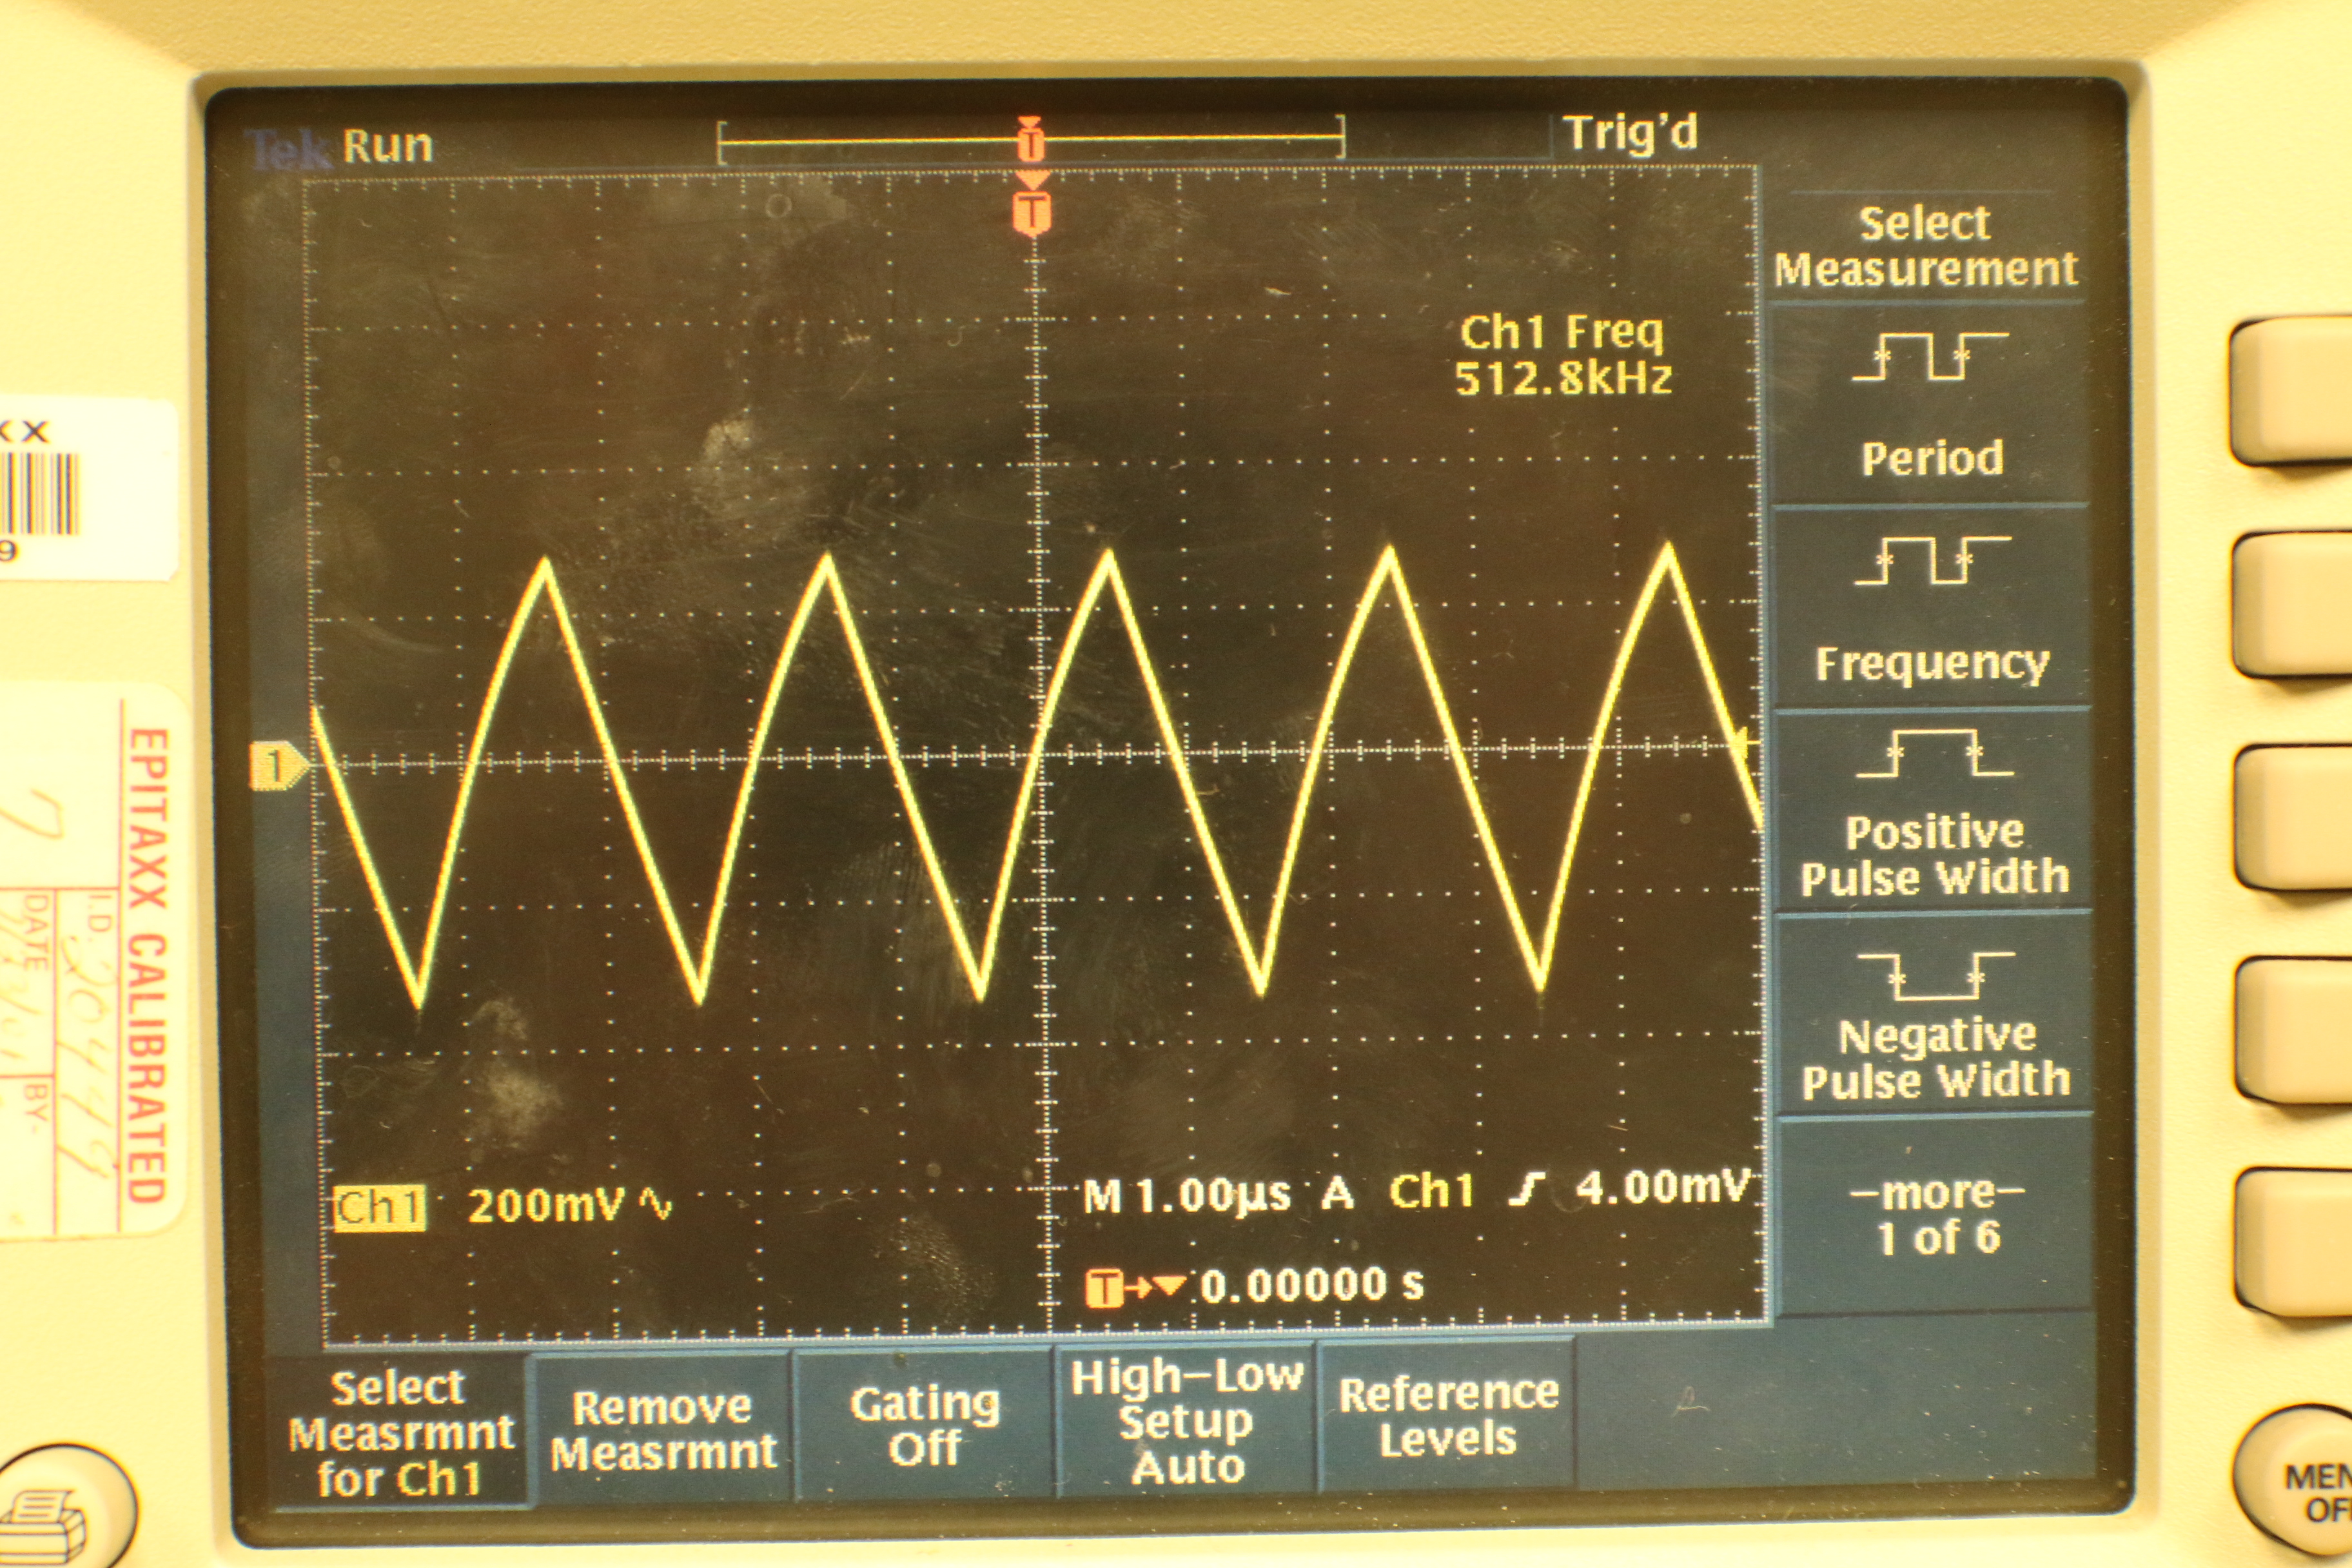
Figure 2: Photo of measured internal triangle wave
Figure 3 shows the single-tone test results. The yellow curve is the input sine wave with a DC biasing voltage of 0.9V. The blue curve is the output sine wave, with an amplitude gain of 3.2.
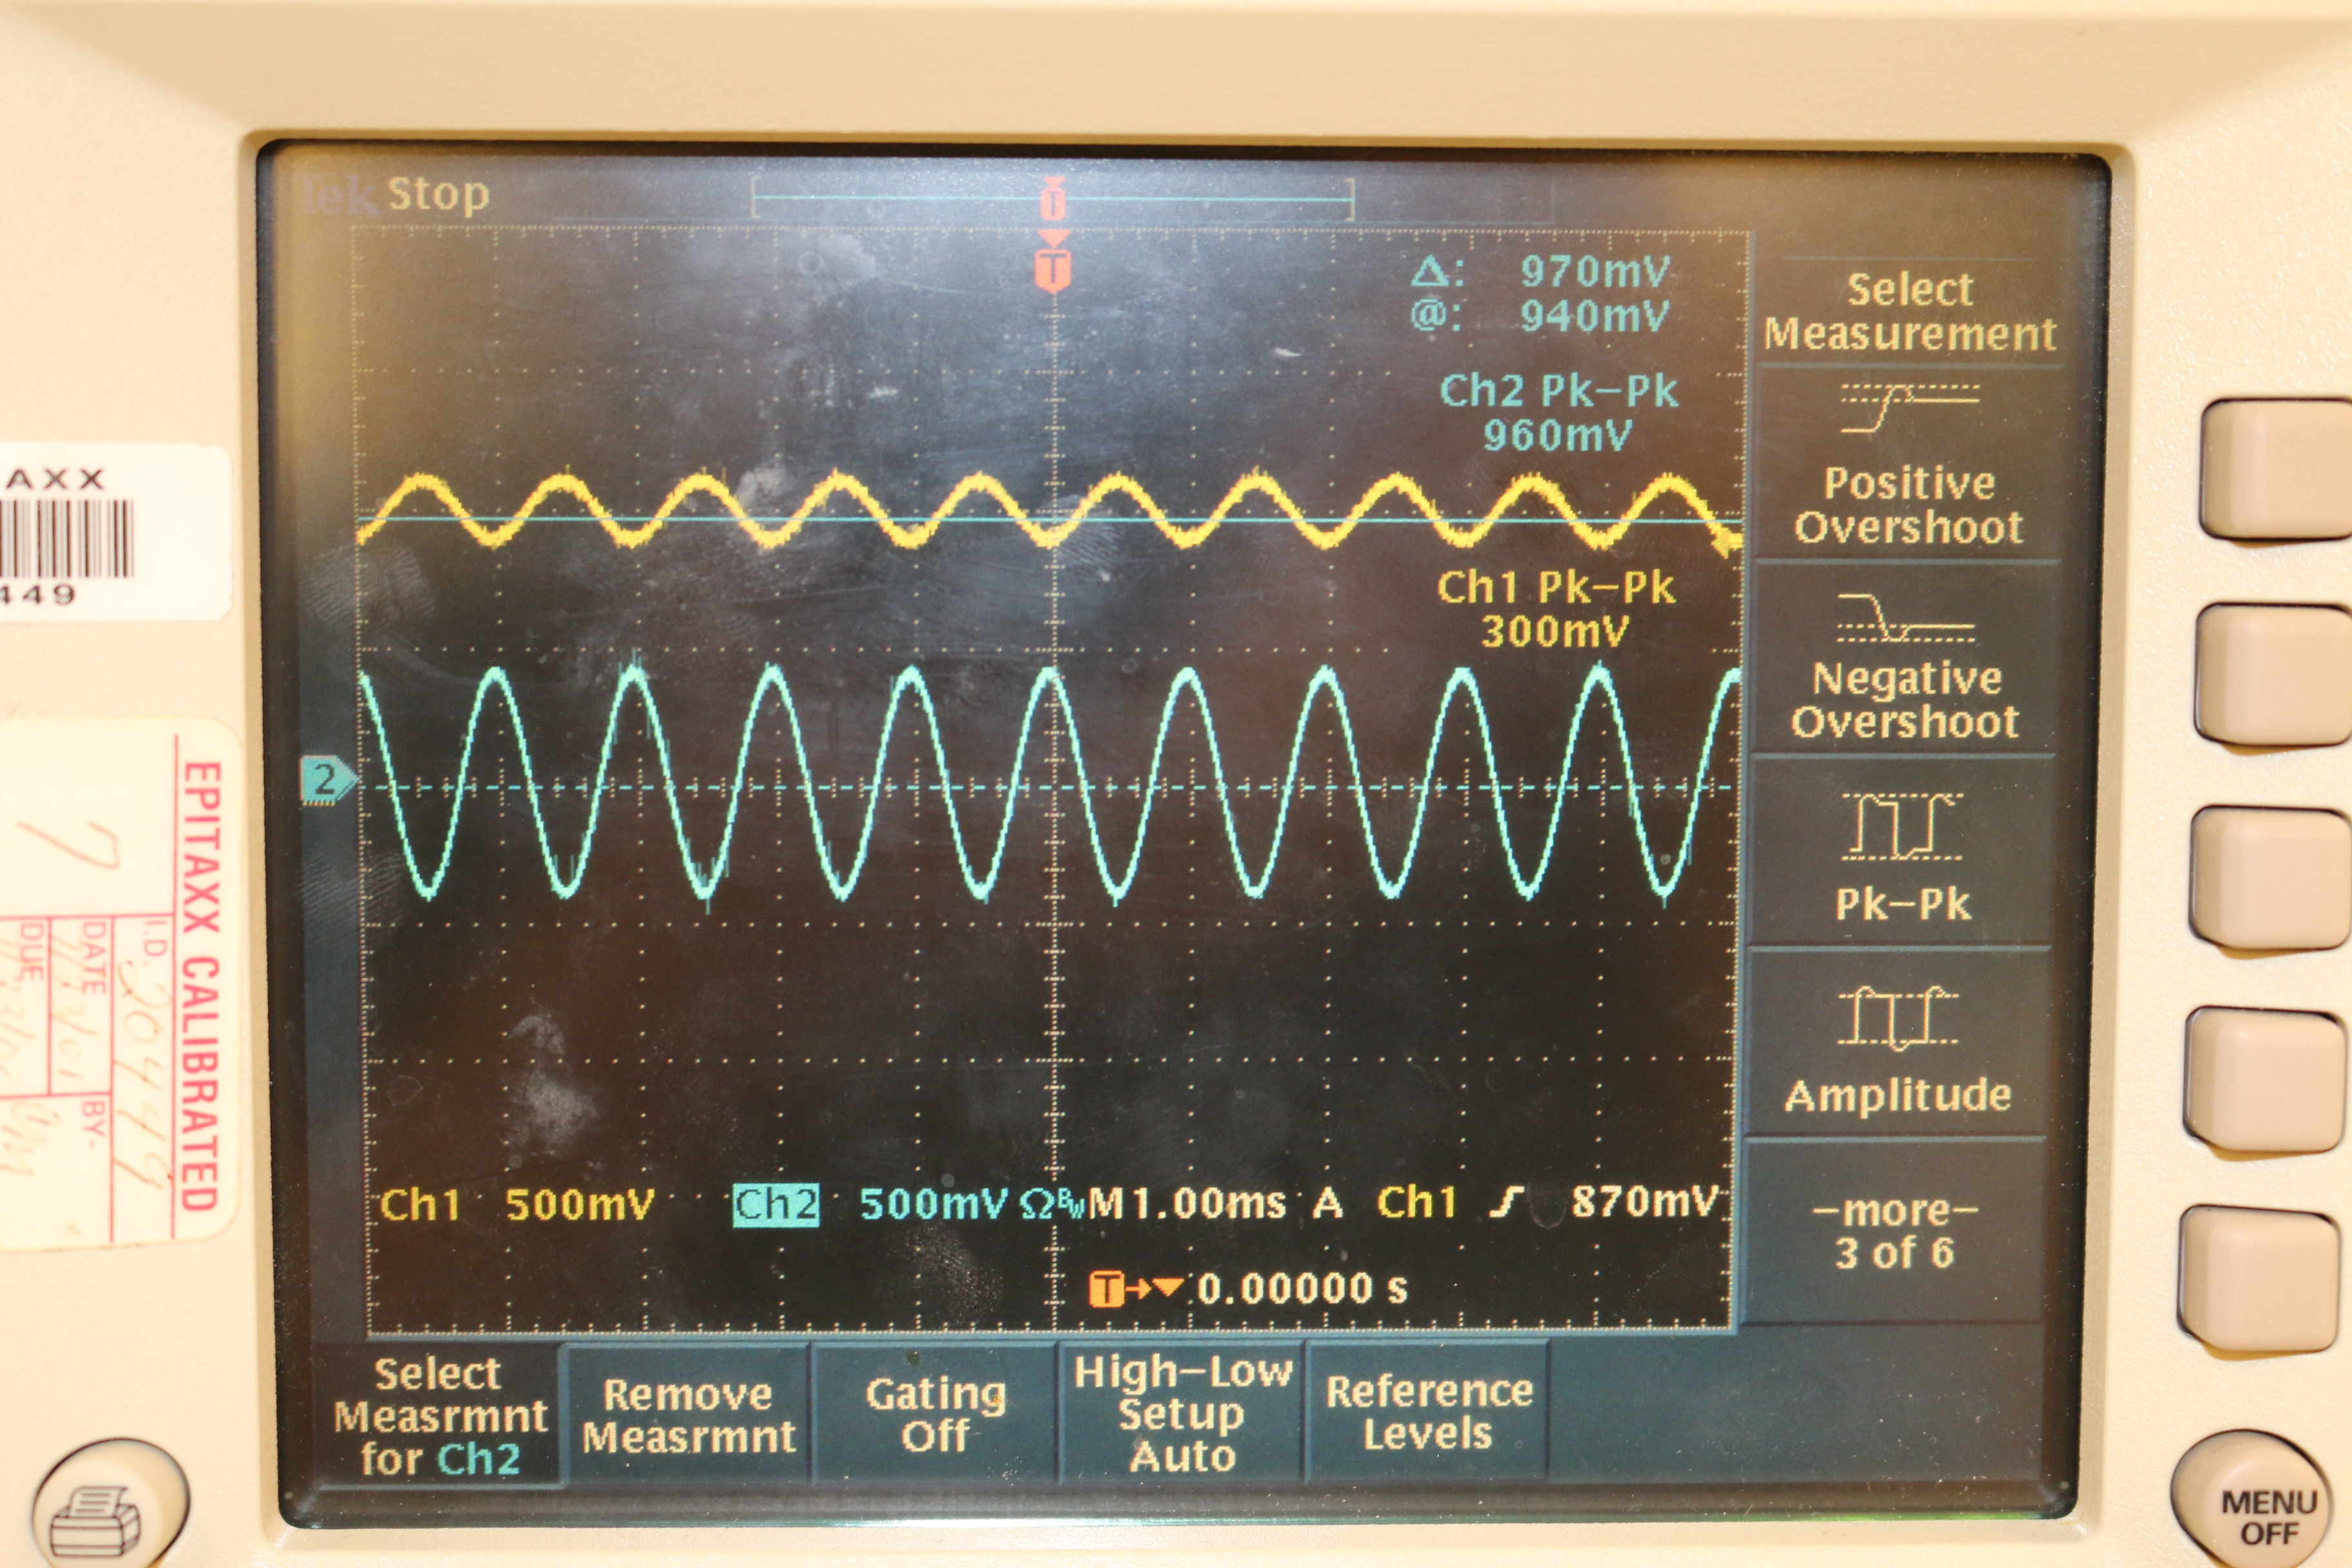
Figure 3: Photo of measured input/output sinusoidal waveforms
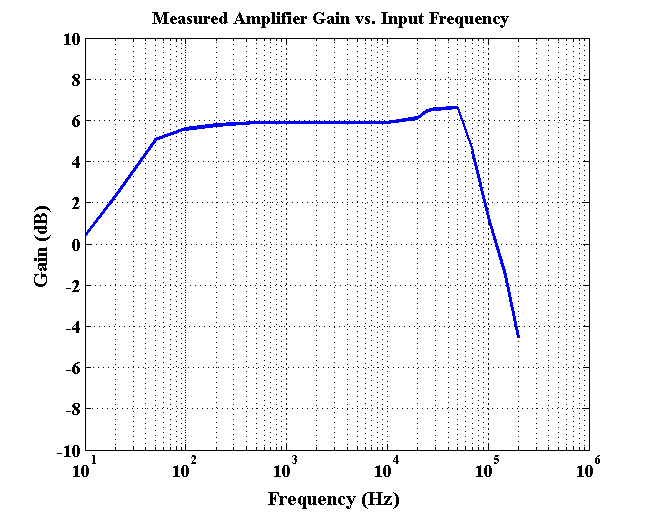
GAIN MEASUREMENT
Figure 4 shows the measured voltage gain with respect to the input frequency. The amplifier has a flat gain ranging from 200 KHz to 20 KHz, which covers almost all the human hearing range (20 Hz to 20 KHz).