Simulation Results
Mixer
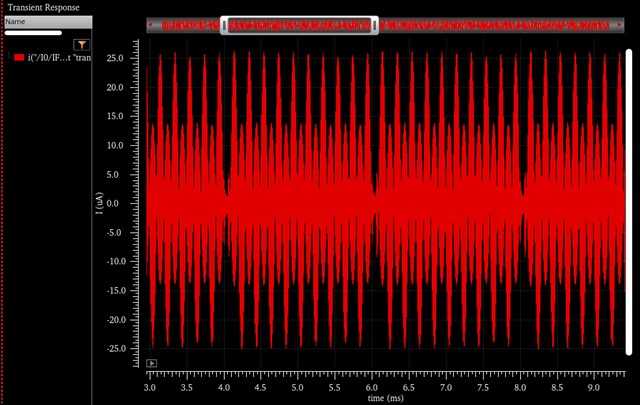
LO signal: 5 kHz sinusoidal wave modulated with 500 kHz PWM wave.
IF signal: The behavior model for the radar front end generates a baseband signal with a 5 kHz single frequency tone.
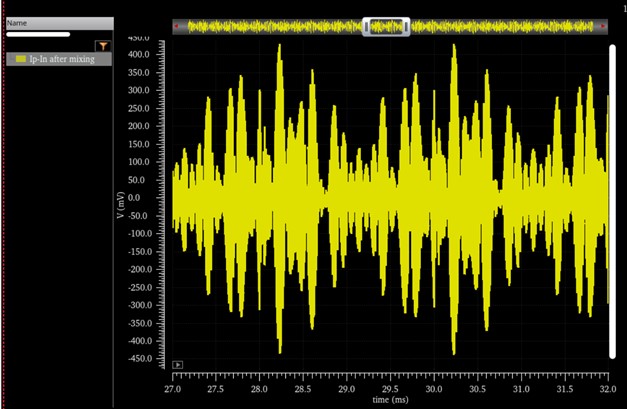
The mixer's output is loaded with a fully differential first-order active low-pass filter. The mixer's differential output current is measured.
.jpg)
.jpg)
8-bit Current-Steering DAC
Input signal:
DAC serial input, sending in a slope from 0-2ms with 125 ksps sampling rate generated in Matlab.
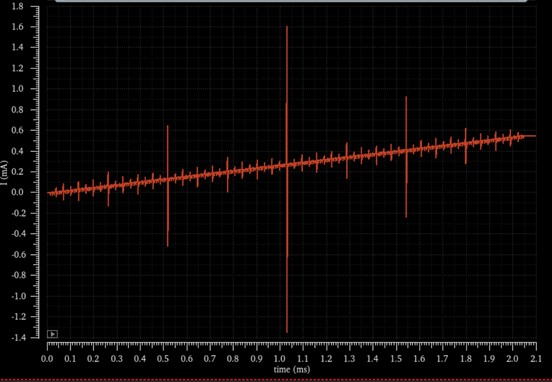
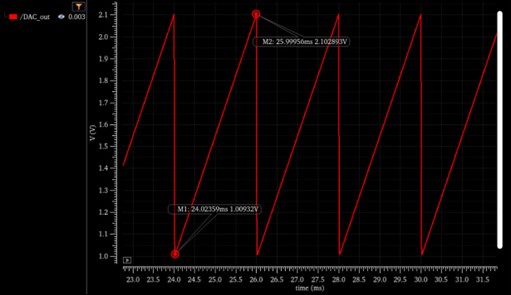
DAC output:
DAC current output, full-scale value is 521 uA, slightly larger than the ideal value (512 uA).
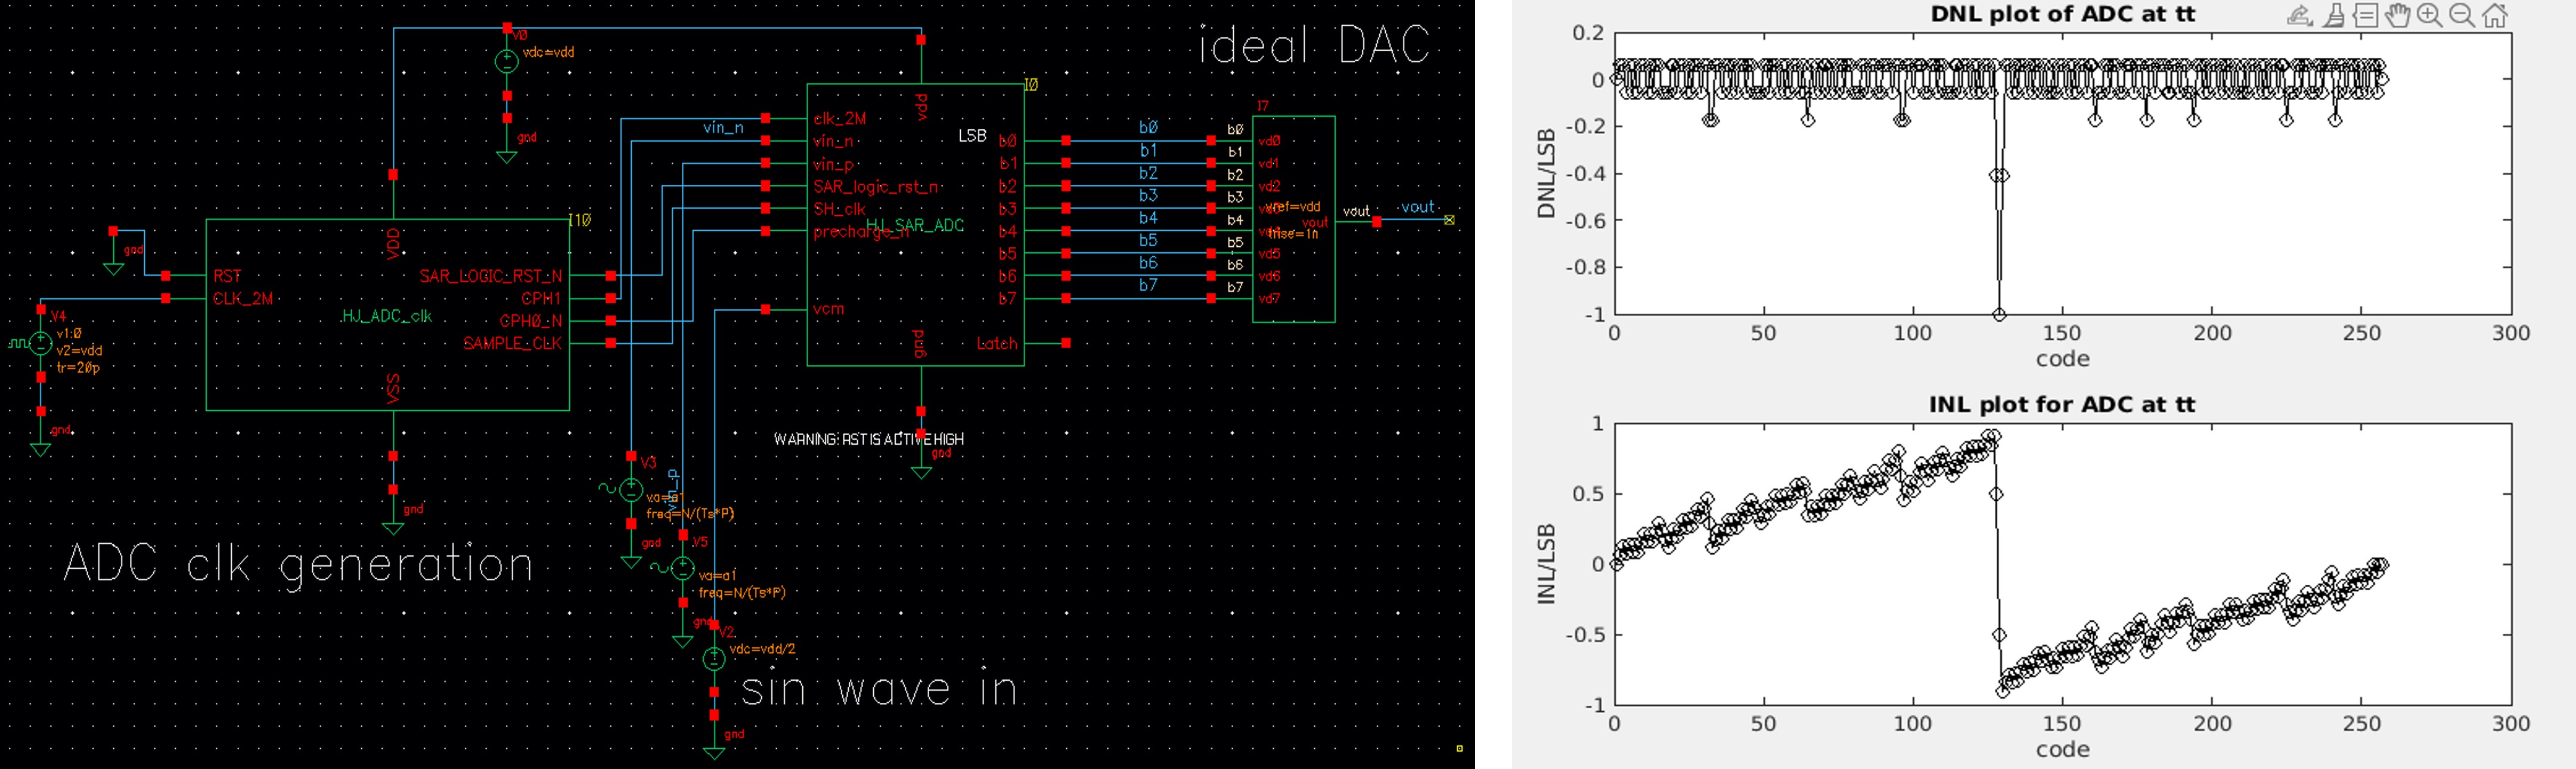
Static Performance
The static performance of the differential DAC can be examined by differential nonlinearity (DNL) and integral nonlinearity (INL). To simulate the DNL and the INL of the DAC, a ramp function should be produced at the output of the DAC. Square wave signals with various durations and delays will be utilized as inputs to the developed DAC to have such a function at the output.
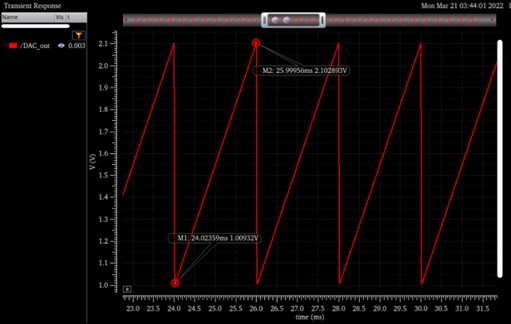
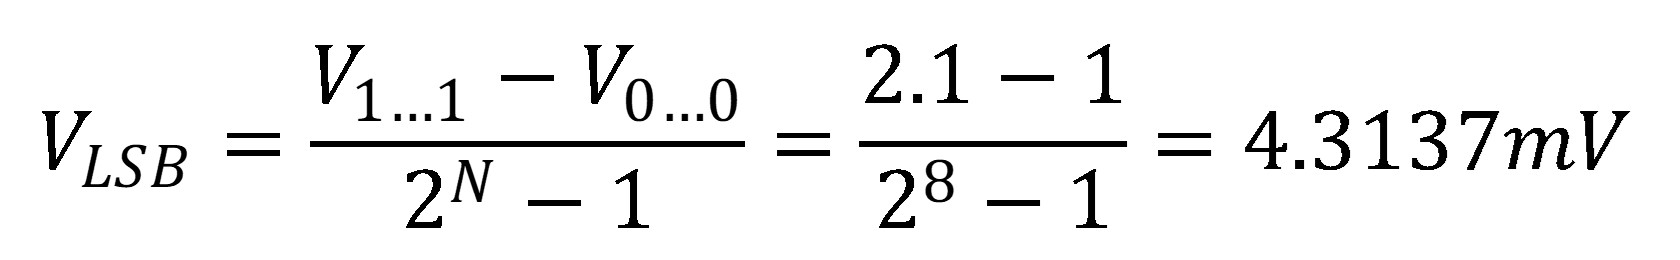
The DAC produced a stair-step function with voltages that ranged from a minimum of 1 V to a maximum of 2.1 V.
The maximum value of DNL and INL is 0.35 LSB and 0.65 LSB respectively.
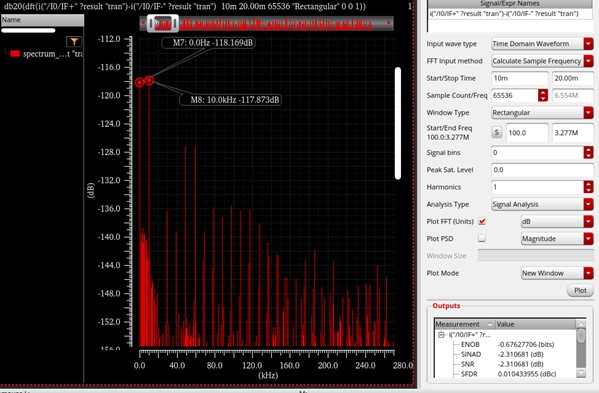
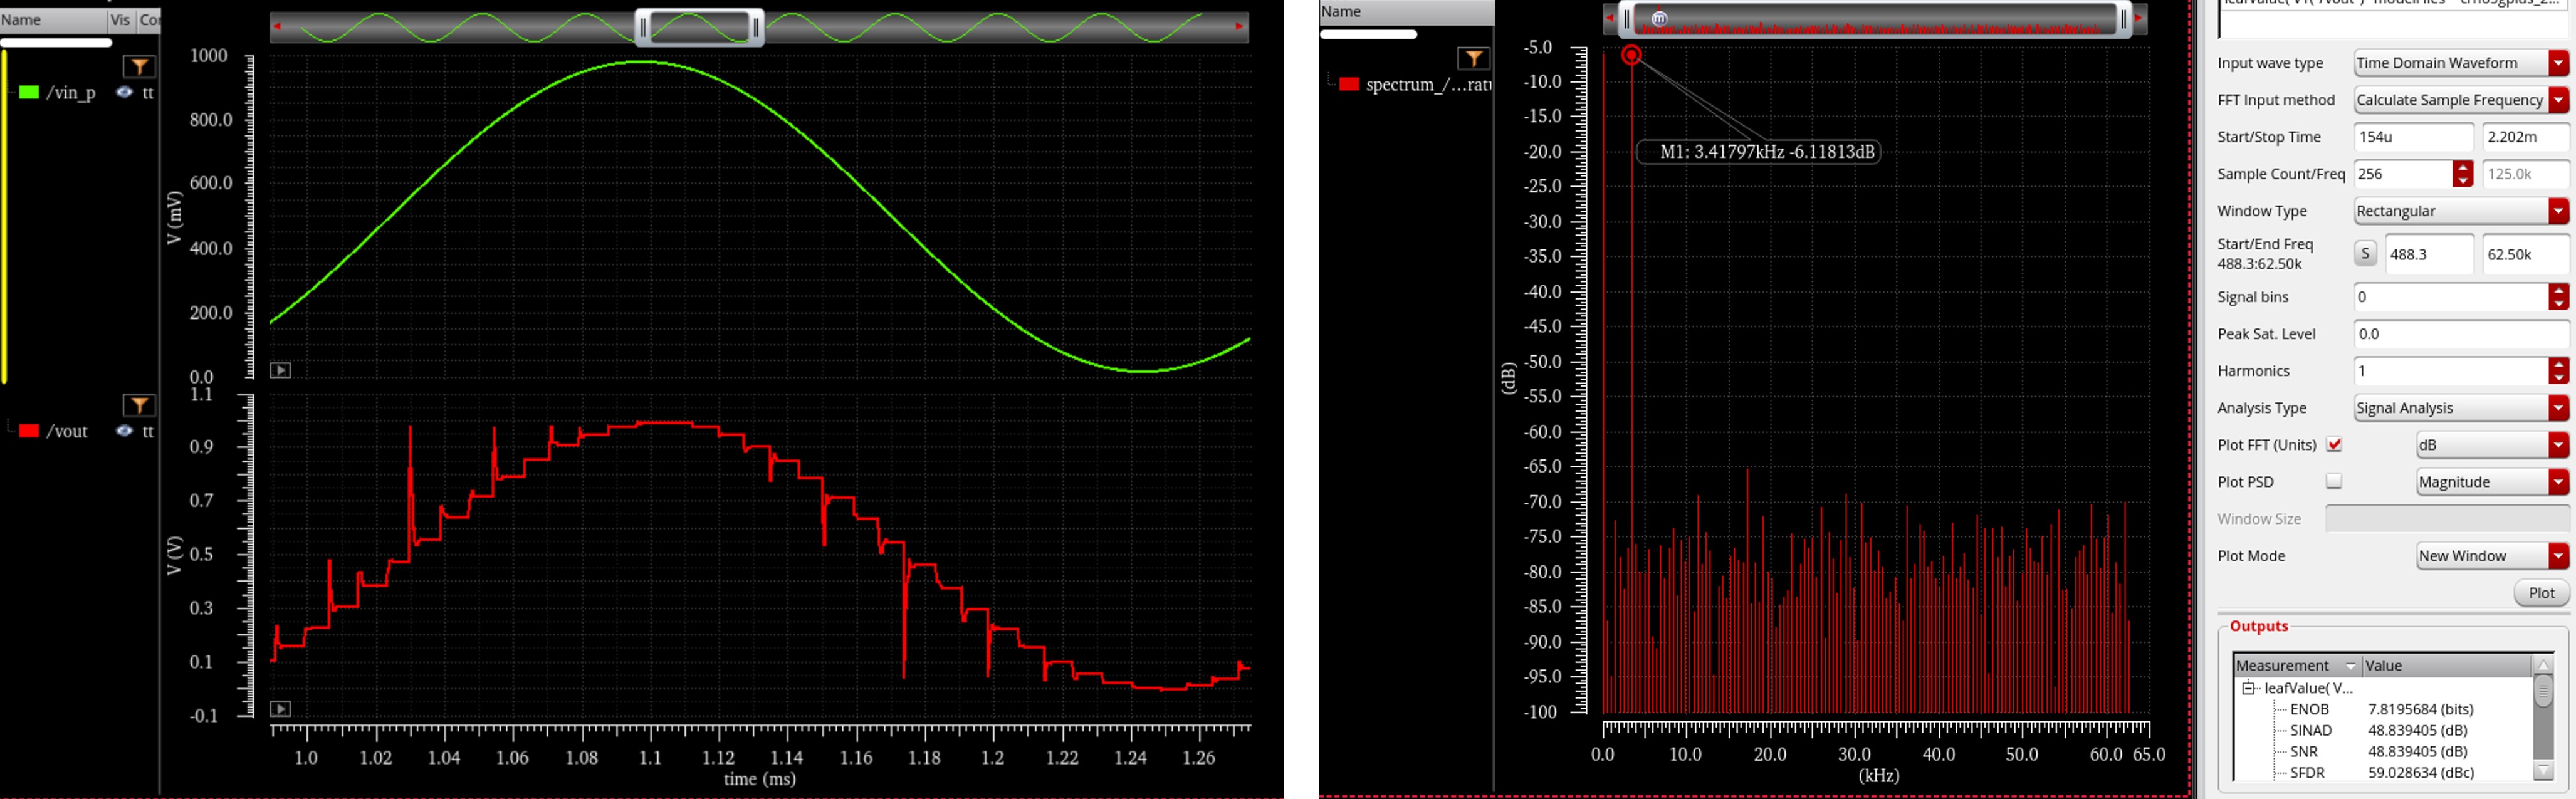
Dynamic Performance
An ideal 8b ADC is used to provide an 8b input data pattern to the DAC.
The input to the ADC is the sinusoidal signal that the DAC is attempting to reconstruct.
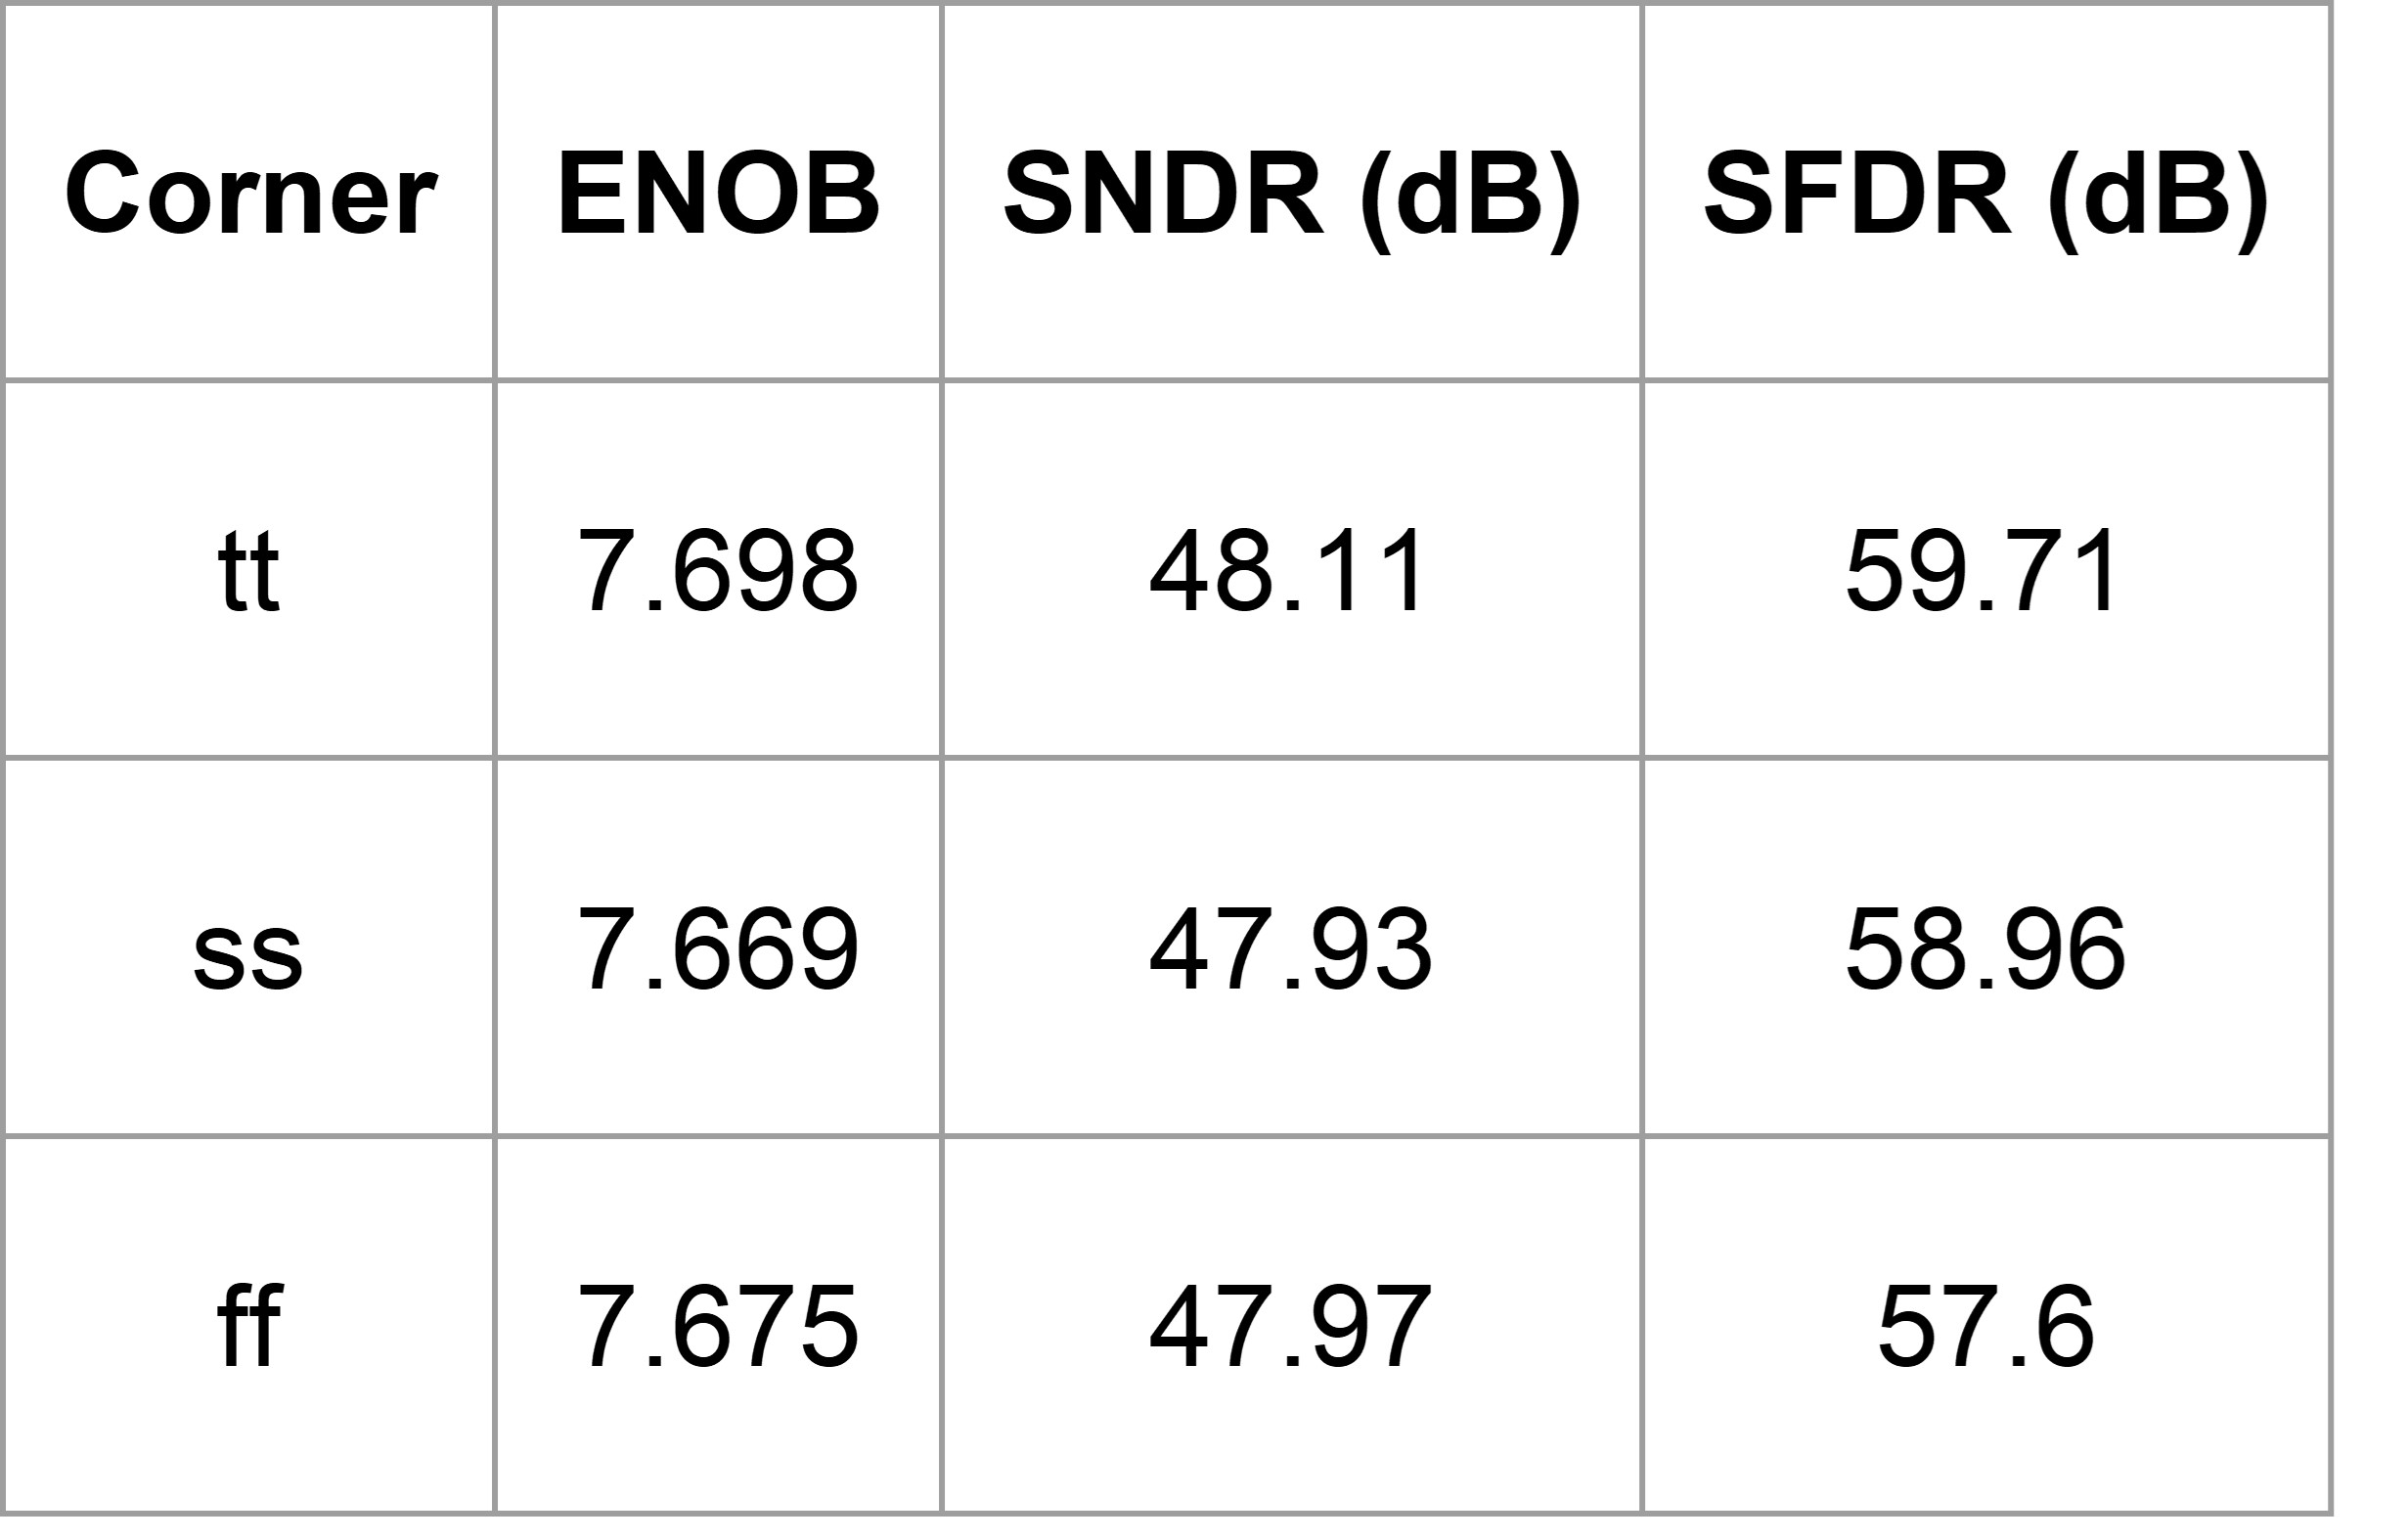
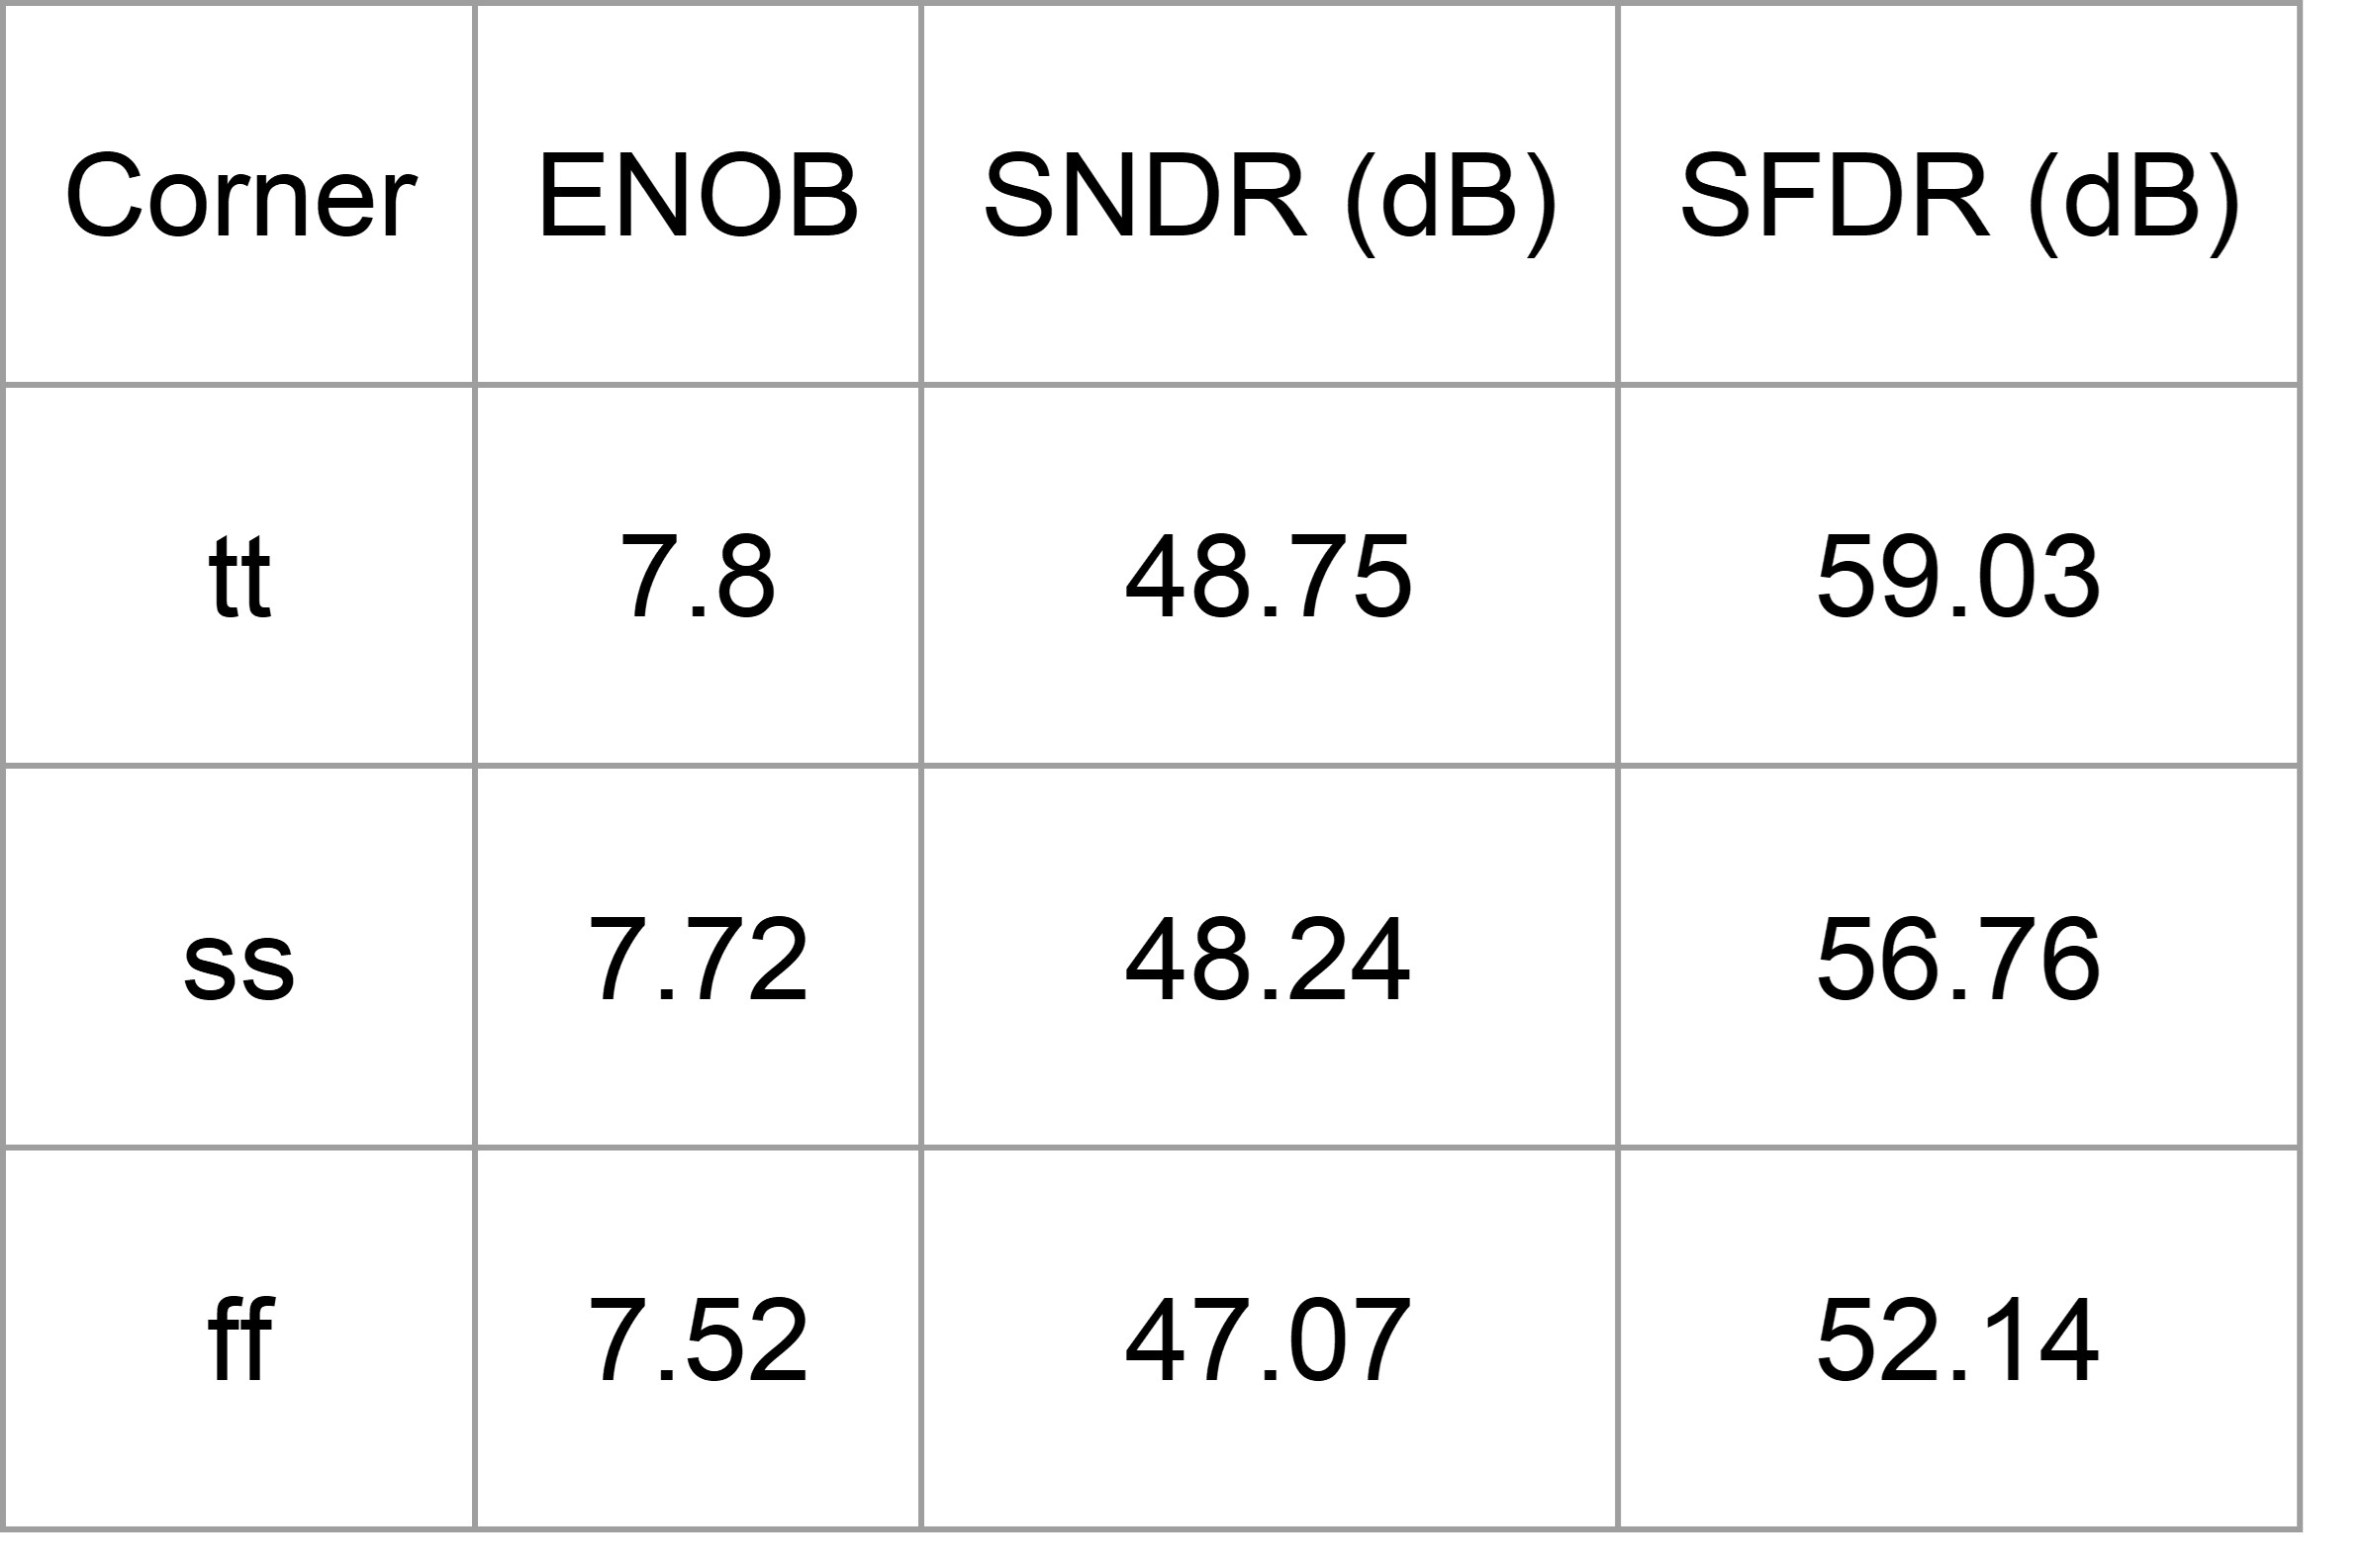
Dynamic test with corner:
Corner:
tt,27, 1
ff, 0, 1.1
ss, 100, 0.9
Input: 7 cycles with 256 samples, Vpp = vdd-0.04
Transient noise bandwidth: 20MHz
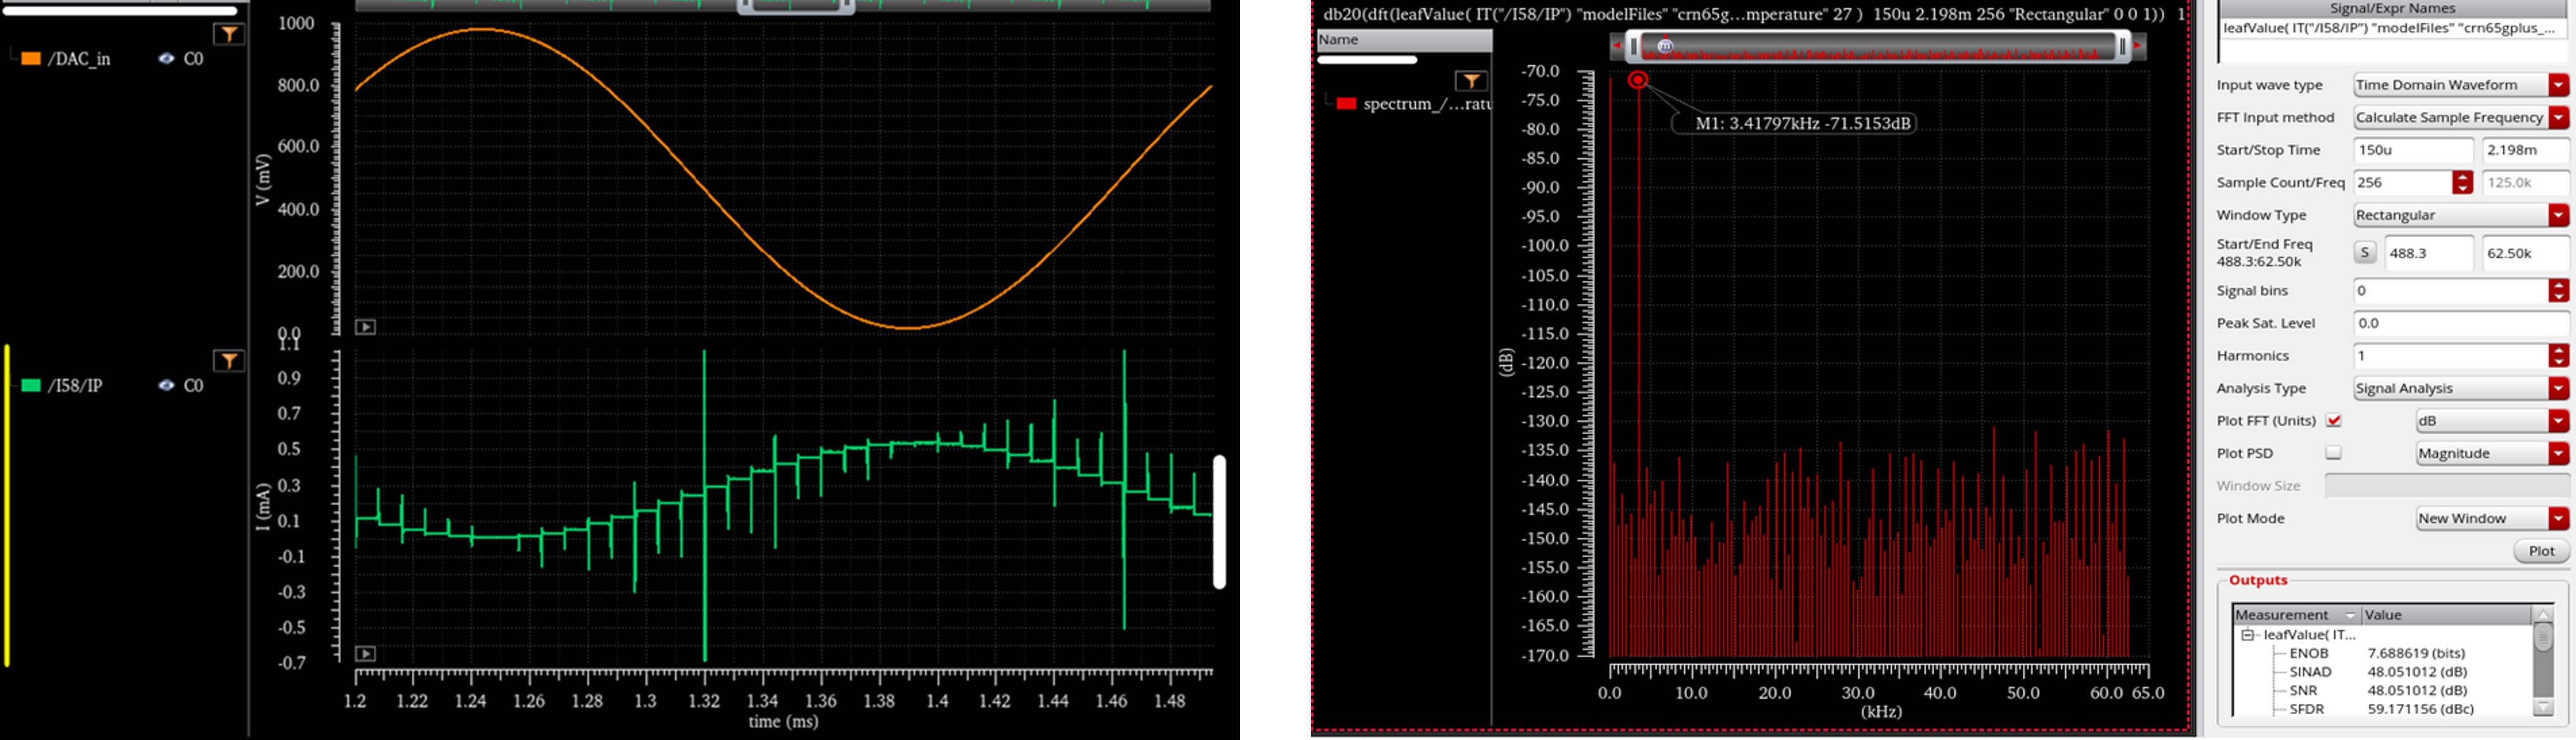
The inverter driver stage is the circuit component that most severely restricts our design. The delay between the DAC inputs and the switch inputs is significantly increased by this circuit block. As a result, these delays may lead to output voltage distortion, which negatively affects converter metrics like SFDR, SNDR, and ENOB.
8-bit SAR ADC
Static Performance
Dynamic Performance
Dynamic test with corner:
Corner:
tt,27, 1
ff, 0, 1.1
ss, 100, 0.9
Input: 7 cycles with 256 samples, vpp = vdd-0.04
Transient noise bandwidth: 20MHz
Zero-Crossing Counter
A 1 kHz sine wave is generated with the radar behavior model operating in doppler mode. The zeros crossing counter will send the time gap between two zeros crossing points in the form of serialized data to the FPGA, as shown below.
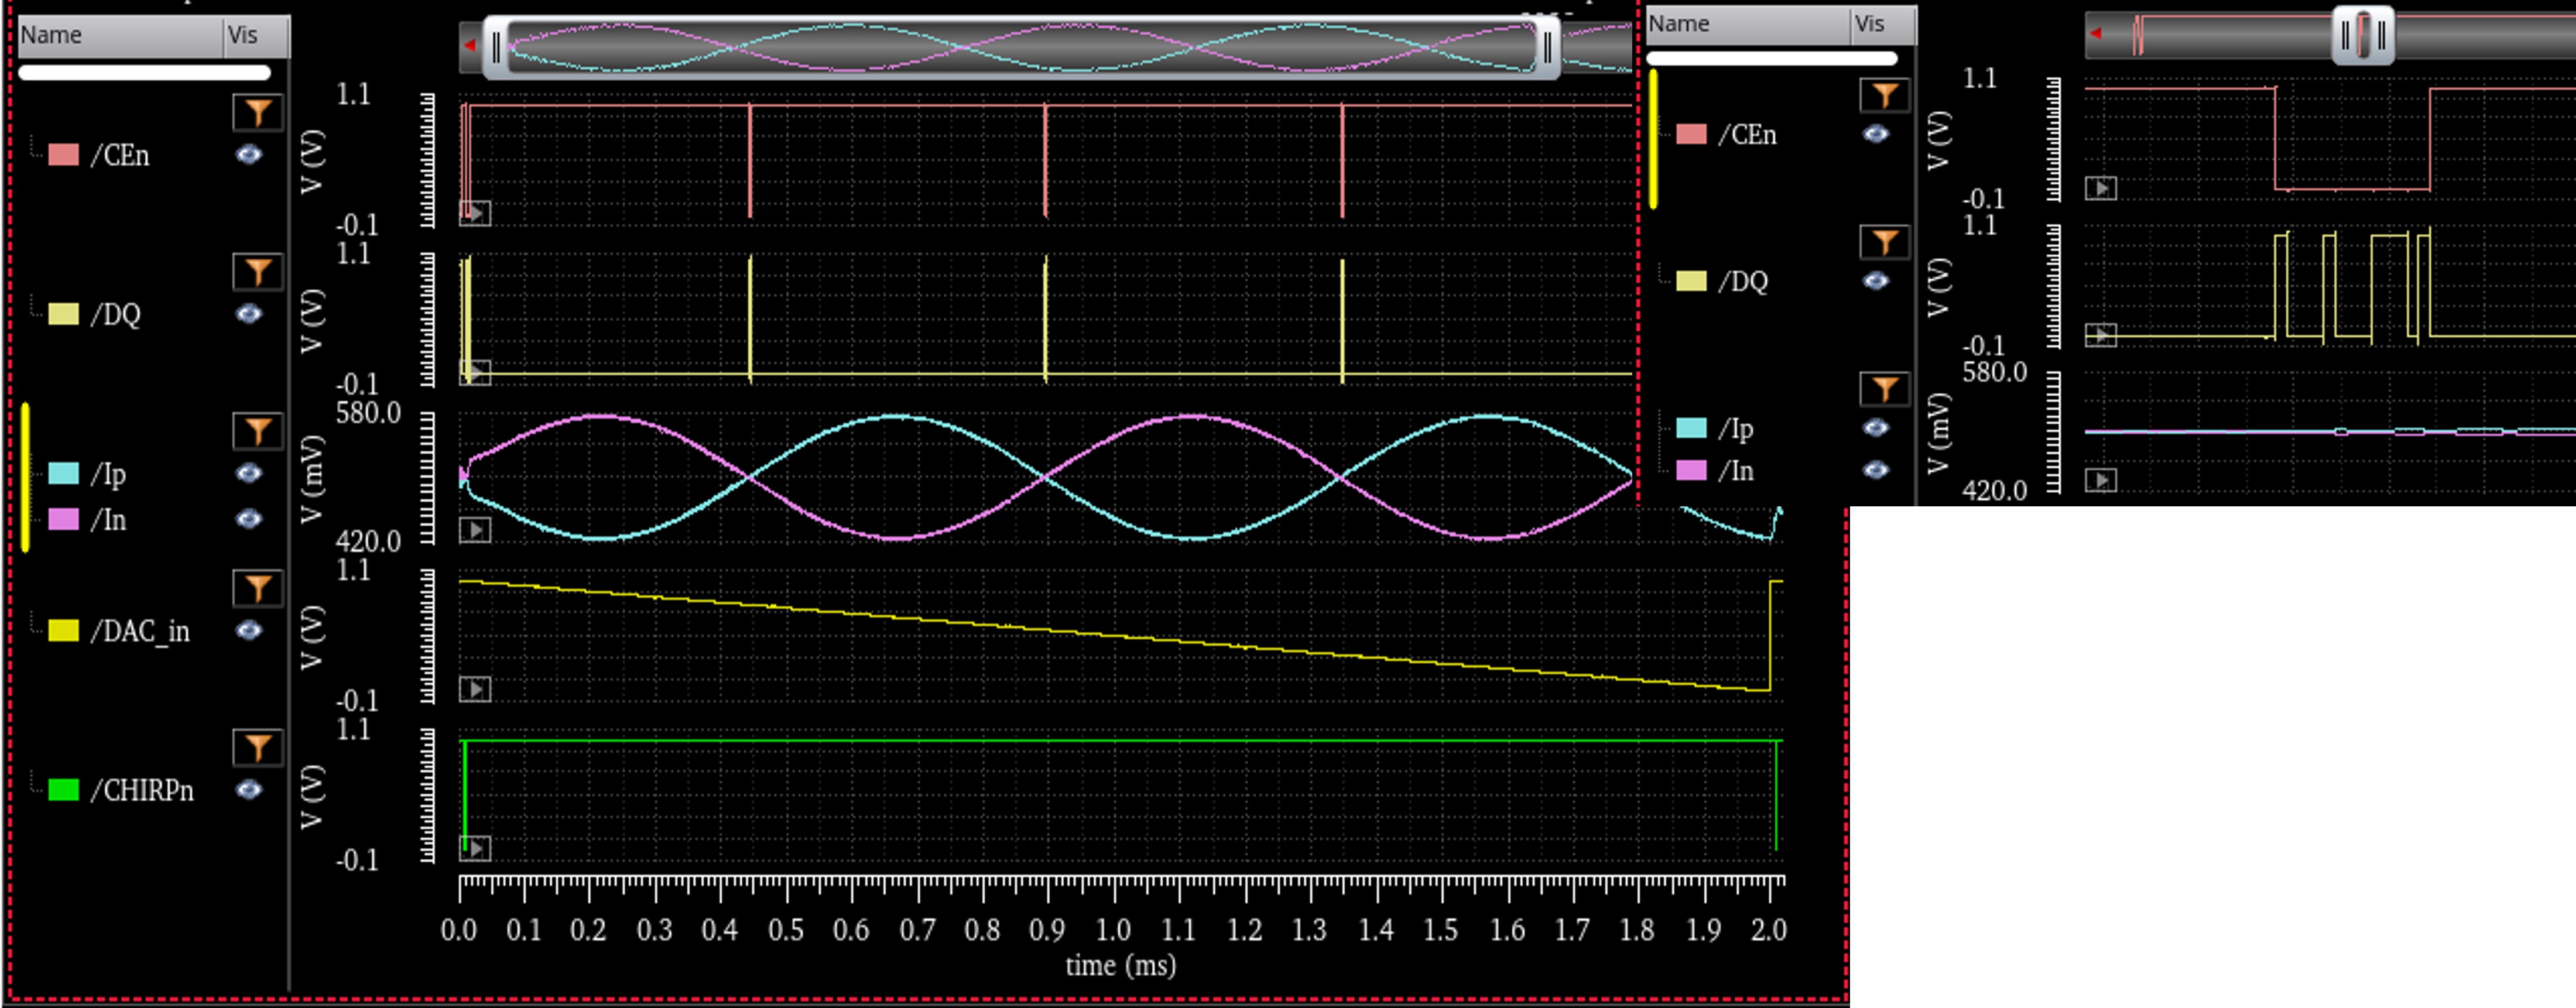
Sweeping Spectrum Analyzer
DAC is used to generate modulation signals in this simulation.
DAC is loaded by an External TIA.
Sawtooth from DAC, used to modulate the radar, ranging from 1V~2.1V. Ideally, it should be 0V-5V, by adjusting the conversion gain of the radar we can achieve the same effect in simulation. In reality, we can change the gain of the TIA to manipulate the voltage range.
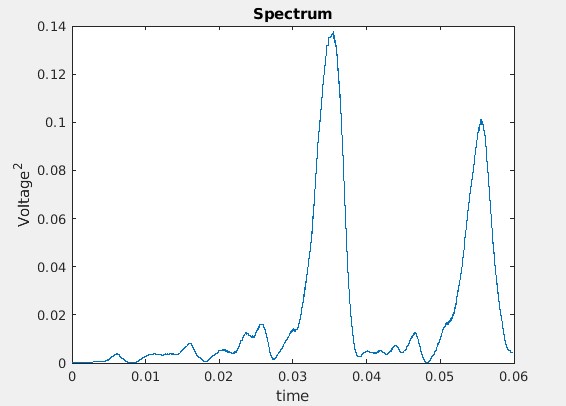
IF signal generated from radar (IF_I+ - IF_I-), containing 3 frequency components, 2kHz, 2.5kHz, 5kHz. The same waveform is reoccurring every 2 ms, in accordance with the chirp duration.
.jpg)
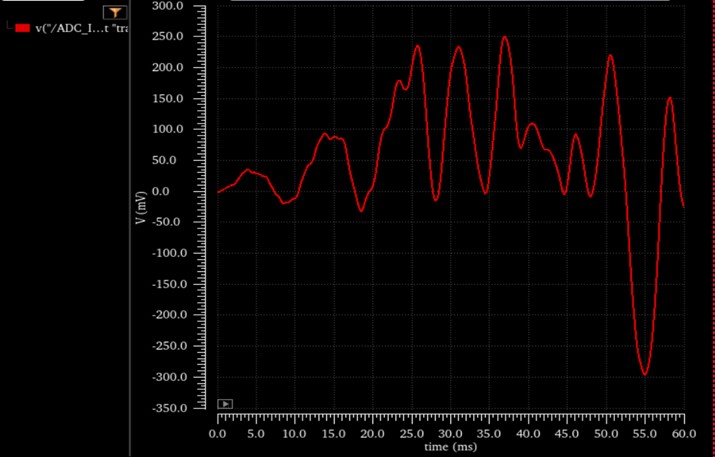
Sample the serialized data for both I and Q in Matlab, and perform I^2+Q^2. There are 2 peaks representing a 2 kHz signal and a 2.5 kHz signal. The actual time of occurrence for both peaks is larger than their ideal value because the sawtooth from the DAC has 10% more amplitude than the ideal case.