3. Part 1: Write a front end (Required)
In this part of the exercise, you will be writing an MFCC front end, except for the FFT which will be provided for you. (Pre-emphasis and adding deltas will be ignored.) To make things easier for you and to make it convenient to run experiments with different portions of the front end, we have written a whole slew of glue code for you. All you have to do is complete the code in three functions implementing three different parts of an MFCC. In a later part of the lab, the signal processing algorithms you implement here will be used in a primitive speech recognizer to evaluate the relative efficacy of different signal processing schemes. Note: There may be differences between the equations given here and the corresponding equations in the slides for the lectures. For the lab, use the versions of the equations given here!! (There is no one “correct” version of MFCC's; different sites have implemented different variations.)
To prepare for the exercise, create the relevant subdirectory and copy over the needed files:
mkdir -p ~/e6884/lab1/ cd ~/e6884/lab1/ cp ~stanchen/e6884/lab1/Lab1_FE.C . cp ~stanchen/e6884/lab1/.mk_chain . |
Computing MFCC's consists of the following steps: windowing, FFT, mel binning (and log), and DCT. The three different functions to be written correspond to these steps minus the FFT. Each function should take a matrix of values (representing the feature values output by the last signal processing module) and produce a new matrix of values. In the case of windowing, the input is a vector of waveform samples rather than a matrix of feature values.
3.1. Algorithms To Implement
3.1.1. Windowing
The first function to be completed takes a sequence of raw waveform samples for an utterance and performs windowing, returning a 2-D array containing the windowed samples for each frame.
That is, before we begin frequency analysis we want to chop the waveform into overlapping windows of samples, so that we can perform short-time frequency analysis on each window. For example, we might choose a window width of 256 samples with a shift of 100 samples. In this case, the first frame/window would contain samples 0 to 255; the second frame/window would contain samples 100 to 355; etc. In terms of the code, the values for the first frame would be written in the locations outBuf[0][0..255], the values for the second frame in outBuf[1][0..255], etc. In the lab, the total number of output frames has been computed for you (i.e., outFrames).
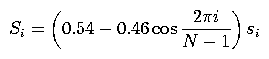
Both rectangular and Hamming windowing should be supported. In rectangular windowing, sample values are unchanged. For Hamming windowing, the values in each frame/window should be modified by a Hamming window. Recall that for samples {si, i = 0, ..., N-1}, the samples {Si} after being Hammed are:
3.1.2. Mel binning
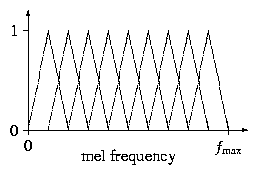
The second function to be completed should implement mel binning. Preceding this step, an FFT will have been performed for each frame on windowed samples {si, i = 0, ..., N-1}, producing an array {Si, i = 0, ..., N-1} of the same size. The real and imaginary parts of the FFT value for frequency i/(N * T) (in Hz) will be held in S2i and S2i+1, respectively, where T is the sampling period for the original signal. In terms of the code, for frame frm this corresponds to the locations inBuf[frm][2*i] and inBuf[frm][2*i+1]. The variable samplePeriod holds the value of T (in seconds). For each frame, the magnitude of the (complex) value for each frequency should be binned according to the diagram in Figure 1. (The number of bins in the diagram should not be taken literally; just the shapes of the bins.) The number of bins to use is held in outDim.
More precisely, the bins should be uniformly spaced in mel frequency space, where
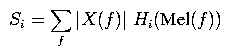
The bins should be perfectly triangular (in mel frequency space!), with the right corner of each bin being directly under the center of the next, as in the diagram. The left corner of the left-most bin should be at mel frequency 0, and the right corner of the right-most bin should be at mel frequency fmax = Mel(1 / (2*T)). To decide the weight with which each FFT magnitude should be added to each bin, take the value of the curve corresponding to the given bin at the given frequency mapped to mel frequency space. That is, the output values {Si} (before the logarithm) should be where X(f) is the output of the FFT at frequency f, f ranges over the set of frequencies evaluated in the FFT, and Hi(fmel) is the height of the ith bin at frequency fmel in Figure 1 (where the left-most bin is the 0th bin). (Note that we are not squaring |X(f)| in the previous equation, as is sometimes done.)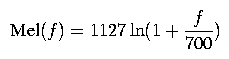
If this all seems very confusing, it's not as bad as it seems. Basically, you just have to implement the previous equation for each frame. For a frame frm, the {Si} are the output values outBuf[frm][i] and the {Xf} are the input values inBuf[frm][i], where you have to translate from indices i into frequencies f as described earlier in this section, and combine the real and imaginary parts for each frequency when computing |Xf|. The Mel function is given above. The trickiest part is figuring out the windowing function Hi(). For help, check out equation (6.141) on page 317 of HAH in the assigned readings. (Don't use the filter centers f[m] suggested in the text as they do things differently. Instead, figure them out by studying Figure 1.)
3.1.3. Discrete Cosine Transform
The third function to be completed should implement the discrete cosine transform. For input values {si, i = 0, ..., N-1}, the output values {Sj, j=0, ..., M-1} are:
where M is the number of cepstral coefficients that you want to keep (i.e., the value outDim). This transform should be applied to the feature values for each frame.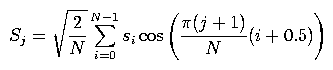
3.2. Compiling and testing
Your front end code will be compiled into the program FETool, which is a tool that takes a waveform, applies a sequence of signal processing modules to it, and prints out the resulting feature vectors. To compile this program with your front end code, type
smk FETool |
To print out feature values for a sample utterance after applying only your windowing module (with Hamming on), type
lab1p1win.sh |
To print out feature values after applying the windowing, FFT, and mel-binning (w/log) modules, type
lab1p1bin.sh |
lab1p1all.sh |