For problem 2, here are the images:
Original Lena: 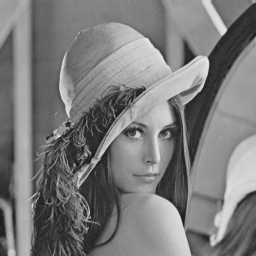
Uniform quantized to 8 levels: 
Contrast quantized to 8 levels: 
I'm fairly surprised that the contrast quantization looks worse than the uniform. The problem is that even though it has 8 levels, it is actually using much fewer quantization levels than the uniform quantizer. What happened is that, even though there is finer quantization at low luminance, most of the smooth areas in the image are actually regions of high luminance. So the contrast quantizer has even fewer levels to use up there. The MSE error for the uniform quantization is 325 (20dB), and the contrast quantizer error is 963 (8dB).
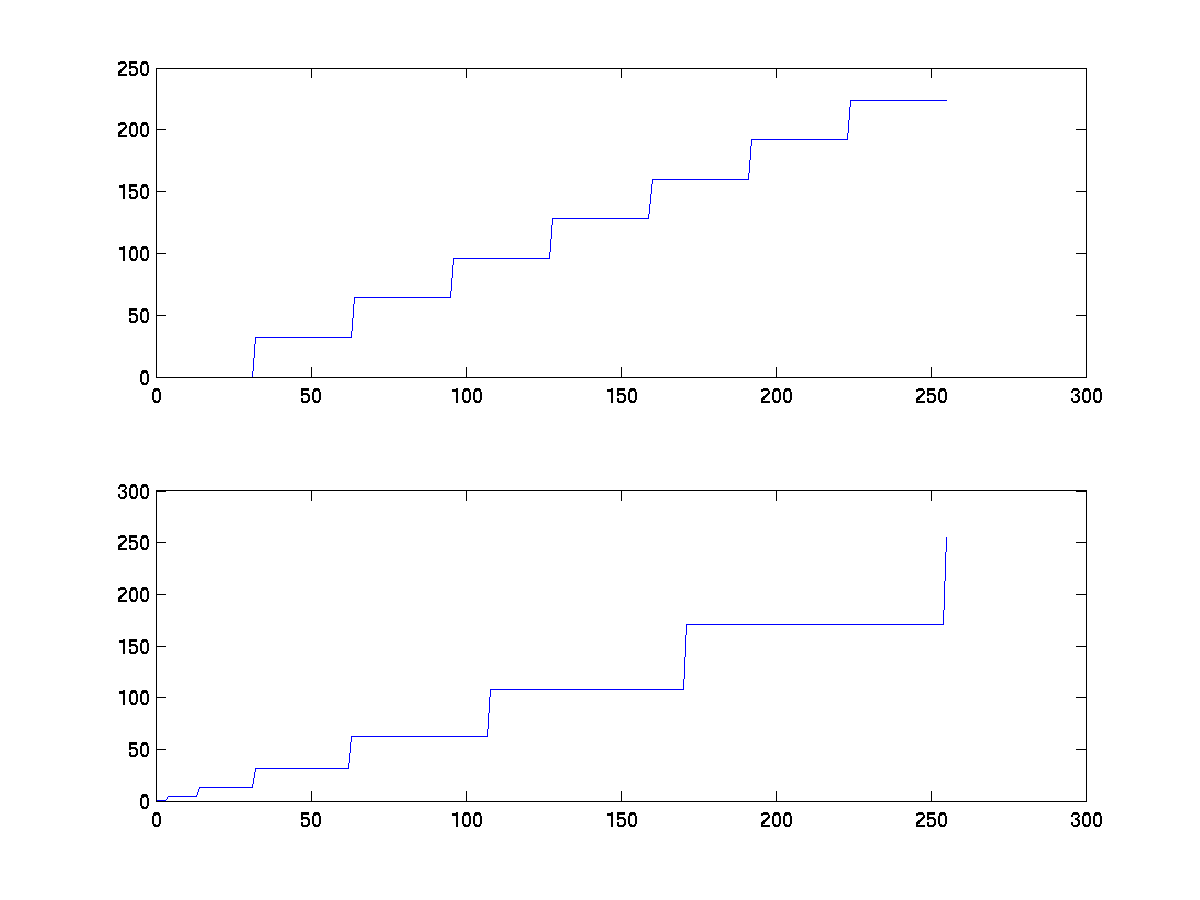
Below is an excerpt from a matlab diary using the quant.m function linked to above. This shows the generation of the plots of the quantization functions shown here. In that diagram, the top plot shows the uniform quantization function, and the bottom plot shows the contrast quantization. Note how the quantization steps get coarser as luminance increases, which is the idea.
n = 0:255

q = 256/8

q =

    32

plot(n,floor(n./q)*q)
cn = n.*(100/255);
cn = cn.^(1/3);
A = 100^(1/3)

A =

    4.6416

q = A/8

q =

    0.5802

plot(n,cn)
qc = floor(cn./q)*q;
plot(n,qc)

qc = qc.^3;
max(qc)

ans =

  100.0000

qc = qc.*(255/100);
max(qc)

ans =

  255.0000

plot(n,qc)
% looks right - wider quantization steps at brighter intensity
subplot(211)
plot(n,floor(n./q)*q)
subplot(212)
plot(n,qc)
subplot(211)
q = 256/8

q =

    32

plot(n,floor(n./q)*q)
c = quant(a,8,'contrast');

mse =

  962.9296

exit