M3.16. Below are the pole-zero plots generated during this
matlab session:
num =[4 15.6 6 2.4 -6.4];
den = [3 2.4 6.3 -11.4 6];
[r,p,k] = residuez(num,den)

r =

   0.0175 - 0.7087i
   0.0175 + 0.7087i
   1.1825 - 0.3934i
   1.1825 + 0.3934i


p =

  -1.0000 + 1.7321i
  -1.0000 - 1.7321i
   0.6000 + 0.3742i
   0.6000 - 0.3742i


k =

   -1.0667

% so G(z) = -1.0667 + (0.0175 - 0.7087i)/(1 - (-1.0000 + 1.7321i)z^-1) + ...

% make the pole-zero plot
zplane(num,den)
% add in some ROC circles at radius of magnitude of poles..?
ww = abs(p(1))*exp(j*[0:100]*2*pi/100);
hold on
plot(real(ww),imag(ww))
% cool...
ww = abs(p(3))*exp(j*[0:100]*2*pi/100);
plot(real(ww),imag(ww),'r')
title('M3.16 (a) Pole-zero plot with ROC shown')
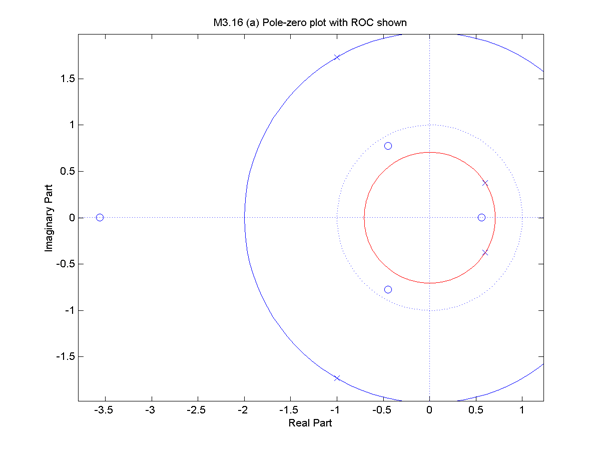 There are three regions of convergence: inside the red circle, in between
the red and solid blue circles, and outside the blue circle. These
correspond, respectively, to a left-sided, two-sided, and right-sided
sequence.
There are three regions of convergence: inside the red circle, in between
the red and solid blue circles, and outside the blue circle. These
correspond, respectively, to a left-sided, two-sided, and right-sided
sequence.
% now part (b)
num = [2 6.4 4.9 -.1 -.6];
den = [5 15.5 31.7 22.52 4.8];
[r,p,k] = residuez(num,den)

r =

   0.1848 - 0.1472i
   0.1848 + 0.1472i
   0.0542
   0.1012


p =

  -1.0500 + 1.7022i
  -1.0500 - 1.7022i
  -0.6000
  -0.4000


k =

   -0.1250

zplane(num,den)
ww = abs(p(1))*exp(j*[0:100]*2*pi/100);
hold on
plot(real(ww),imag(ww),'r')
ww = abs(p(3))*exp(j*[0:100]*2*pi/100);
plot(real(ww),imag(ww),'g')
plot(real(ww),imag(ww),'r')
ww = abs(p(4))*exp(j*[0:100]*2*pi/100);
plot(real(ww),imag(ww),'r')
plot(real(ww),imag(ww),'g')
plot(real(ww),imag(ww),'b')
ww = abs(p(3))*exp(j*[0:100]*2*pi/100);
plot(real(ww),imag(ww),'g')
title('M3.16 (b) Pole-zero plot with ROC shown')
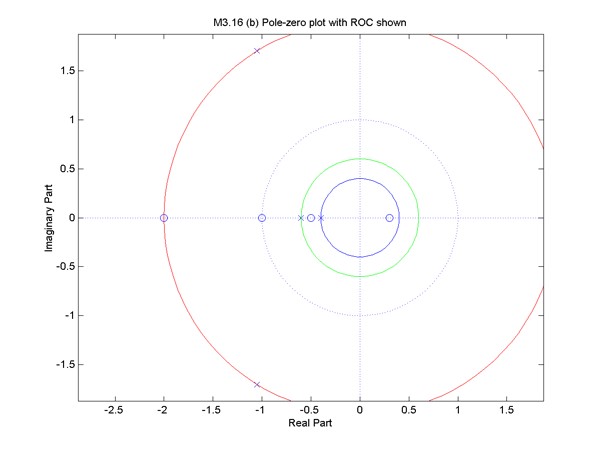 There are four regions of convergence: Inside the blue circle,
between the blue and green circles, between the green and
red circles, and outside the red circle. The inside region
corresponds to a left-handed sequence, the two annular regions
to two-sided sequences , and the outside region to a right-sided
sequence. NOte that the DTFT will only exist for the larger
annular region, in other words for a two-sided sequence.
There are four regions of convergence: Inside the blue circle,
between the blue and green circles, between the green and
red circles, and outside the red circle. The inside region
corresponds to a left-handed sequence, the two annular regions
to two-sided sequences , and the outside region to a right-sided
sequence. NOte that the DTFT will only exist for the larger
annular region, in other words for a two-sided sequence.