In this tutorial you will learn the basic usage of VisGenie instantly through some built-in demos and quick projects. The content is divided into two parts: corresponding to the fundamental functions of VisGenie: building demo projects and creating video analysis platforms.
NOTE:
![]() The instructions and screen shots provided in this tutorial are based on version 0.8.0.0Beta and Windows XP Professional platform. For other Windows platforms and versions, there might be minor differences.
The instructions and screen shots provided in this tutorial are based on version 0.8.0.0Beta and Windows XP Professional platform. For other Windows platforms and versions, there might be minor differences.
![]() The directory VisGenie is installed is denoted as [VisGenie Folder], and the start menu entrance of VisGenie is denoted as [VisGenie in Start Menu]
The directory VisGenie is installed is denoted as [VisGenie Folder], and the start menu entrance of VisGenie is denoted as [VisGenie in Start Menu]
Building Demo Projects Creating Video Analysis Platforms
| Building Demo Projects |
![]() Demos on Demos
Demos on Demos
Before building our first demo project, let's firstly have a quick warming up by reviewing some built-in VisGenie demos.
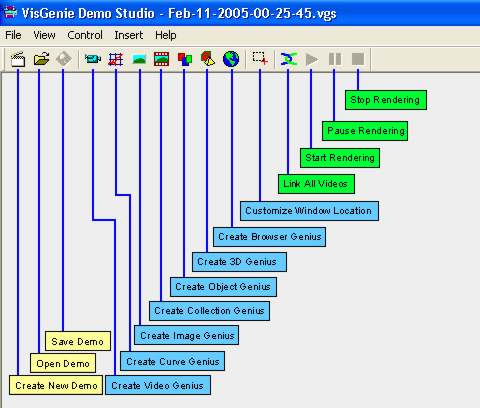
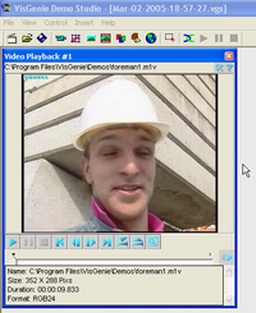
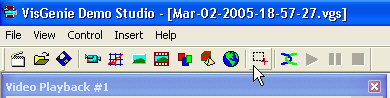
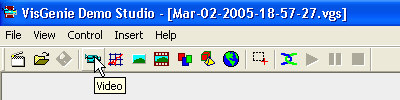
Open VisGenie Demo Studio
Select "[VisGenie in Start Menu] / VisGenie Demo Studio".
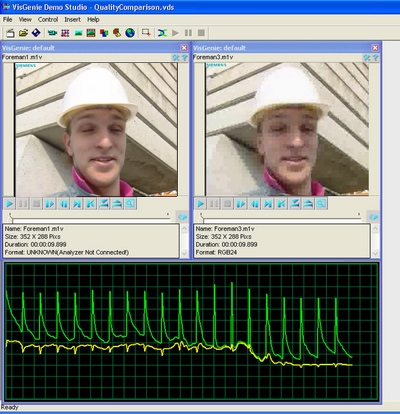
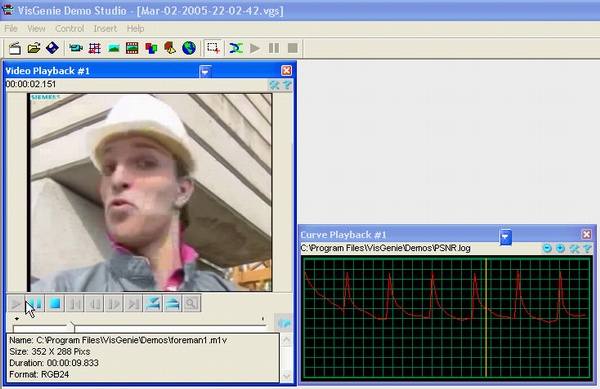
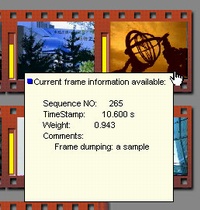
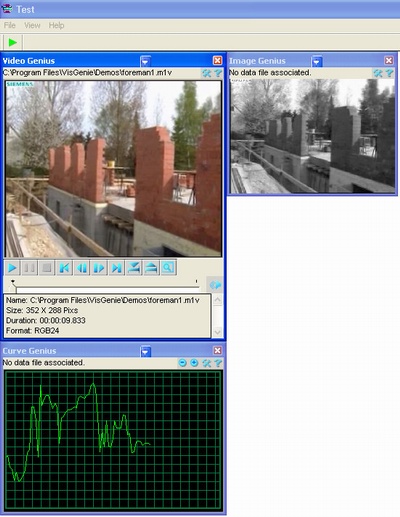
This demo shows two video clips (the famous Foreman sequence) generated by using two different rate control algorithms. The purpose of the demo is to observe the quality improvement, both in PSNR and perceptual visual quality.
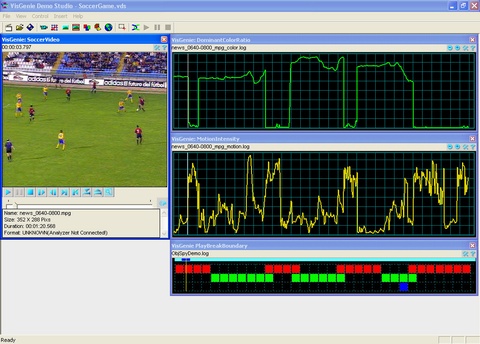
This demo illustrates how to use low level content features to analyze the soccer game structure (i.e., play and break) through some pattern recognition framework. Two content features are adopted: dominant color (the green of the glass) ratio and motion intensity. The analysis result is shown in an object window, play and break indicated as green and red respectively.
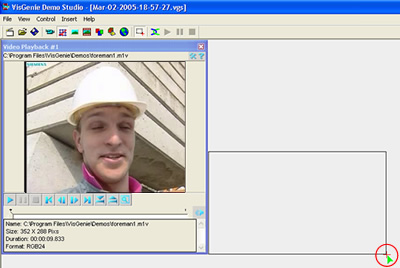
![]() Build Your First VisGenie Demo
Build Your First VisGenie Demo
Now you will learn how to construct your VisGenie demos by just clicks.
.
| Creating Video Analysis Platforms |
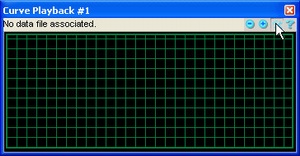
![]() Demos on Video Analysis Platforms
Demos on Video Analysis Platforms
Again, let's firstly have a quick look at some built-in video analysis platforms. .
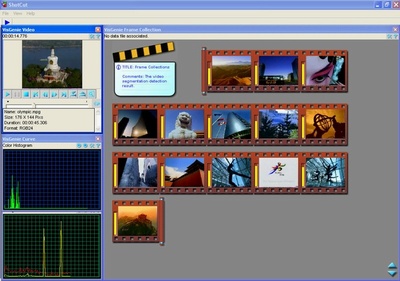
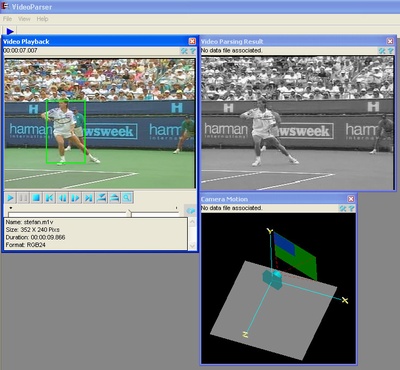
This demo shows a video analysis system that parse the video frames and try to find the shot cuts. Color histogram is adopted as the content feature, and two distance metrics are used: Euclidean distance and Cosine distance.
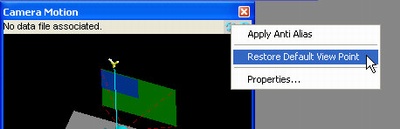
This demo shows a system that estimate the camera motion and track a specified object in the video. The camera motion estimation is realized through affine model regression, and the object tracking is based on Kernel Based Object Tracking. However, for simplification there is no real algorithms in the codes. Instead the camera motion parameters and the tracked coordination were recorded in a data file and retrieved during the playback. The key point here is to understand how VisGenie can provide support for such applications.
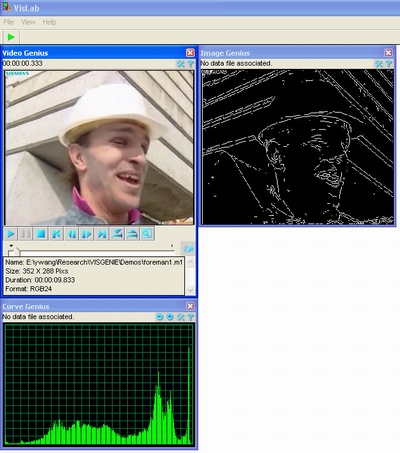
This demo shows a system that integrate the functions in Matlab to help the video processing. Specifically the edge extraction function in Matlab is used to extract the edge map of each video frames.
![]() Building Your First Video Analysis Platform
Building Your First Video Analysis Platform
Before building your first video analysis platform using VisGenie, make sure your system has been configured correctly based on the instruction in System Configuration.
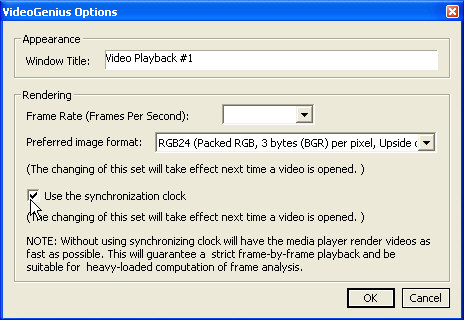
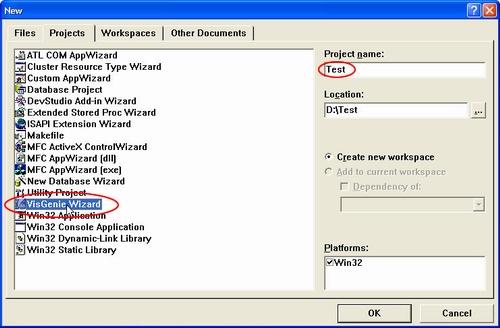
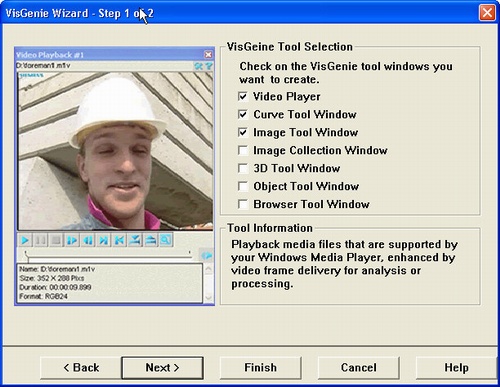
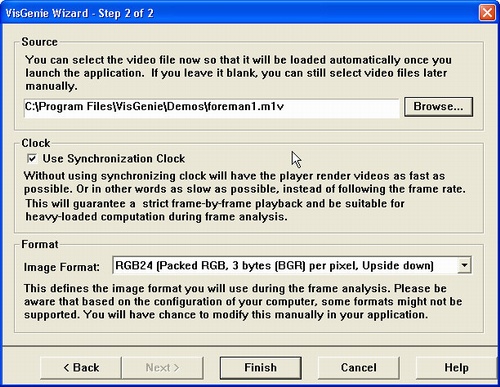
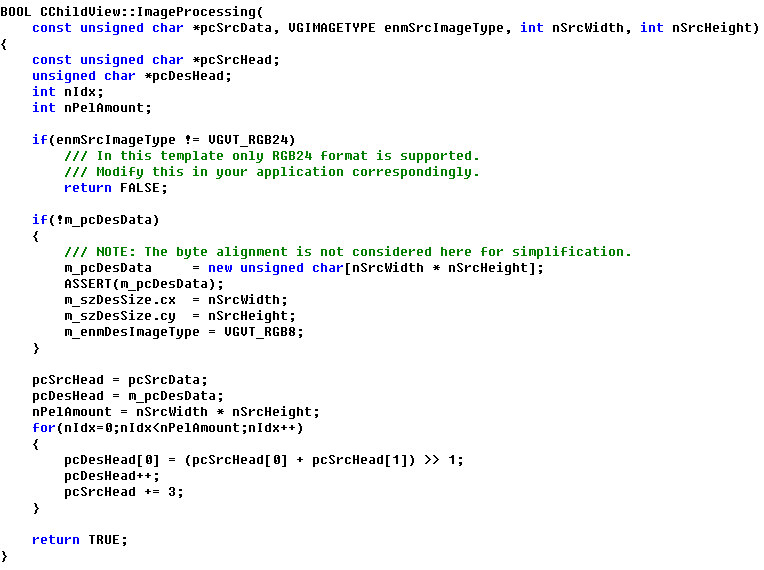
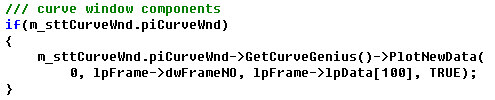
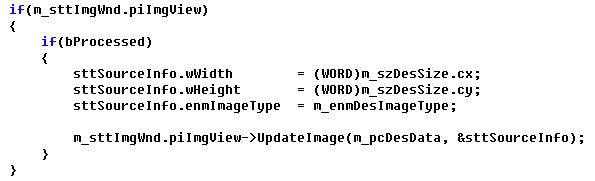
In this session you will learn how to create a VisGenie application through VisGenie AppWizard Note the illustration below is based on Microsoft Visual C++ 6.0. If you are using Visual C++.NET. You can open the project file "[VisGenie in Start Menu] / Example Projects / Video Template" to check the details.

| Summary |
In this tutorial you learn the basic usage of VisGenie through a few built in demos and some simple projects. They are snapshots of VisGenie's fundamental functions. To learn VisGenie in a systematic way, please refer to Using VisGenie and VisGenie Reference.
![]()