
Conclusion
Linearity - INL and DNL measurements
The data from the static test for every input was collected and written in excel file. From there, a slow ramp input was given, inverted ramp output was obtained and the linearity, DNL and INL of the result were calculated as below.
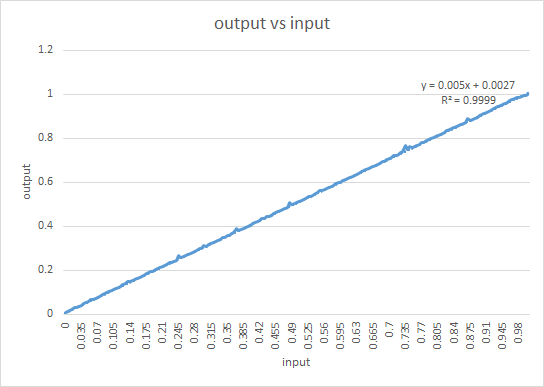
Based on plots, the output ramp is almost linear. The crude data was taken in MATLAB and the ramp was extracted out (sudden transitions were not to be included to remove stray counts). The raw data was then normalized between 0 and 1. The histogram of the given points was computed using 256 bins as below:
[counts,centres] = hist(data,256)
Where the counts represent the number of data per bin and centres represent average value of the bin.
DNL was then calculated on the basis of the following equation:
DNL = counts/mean(counts) - 1
and INL is just the cumulative sum of the DNL values.
The plots produced were as below:
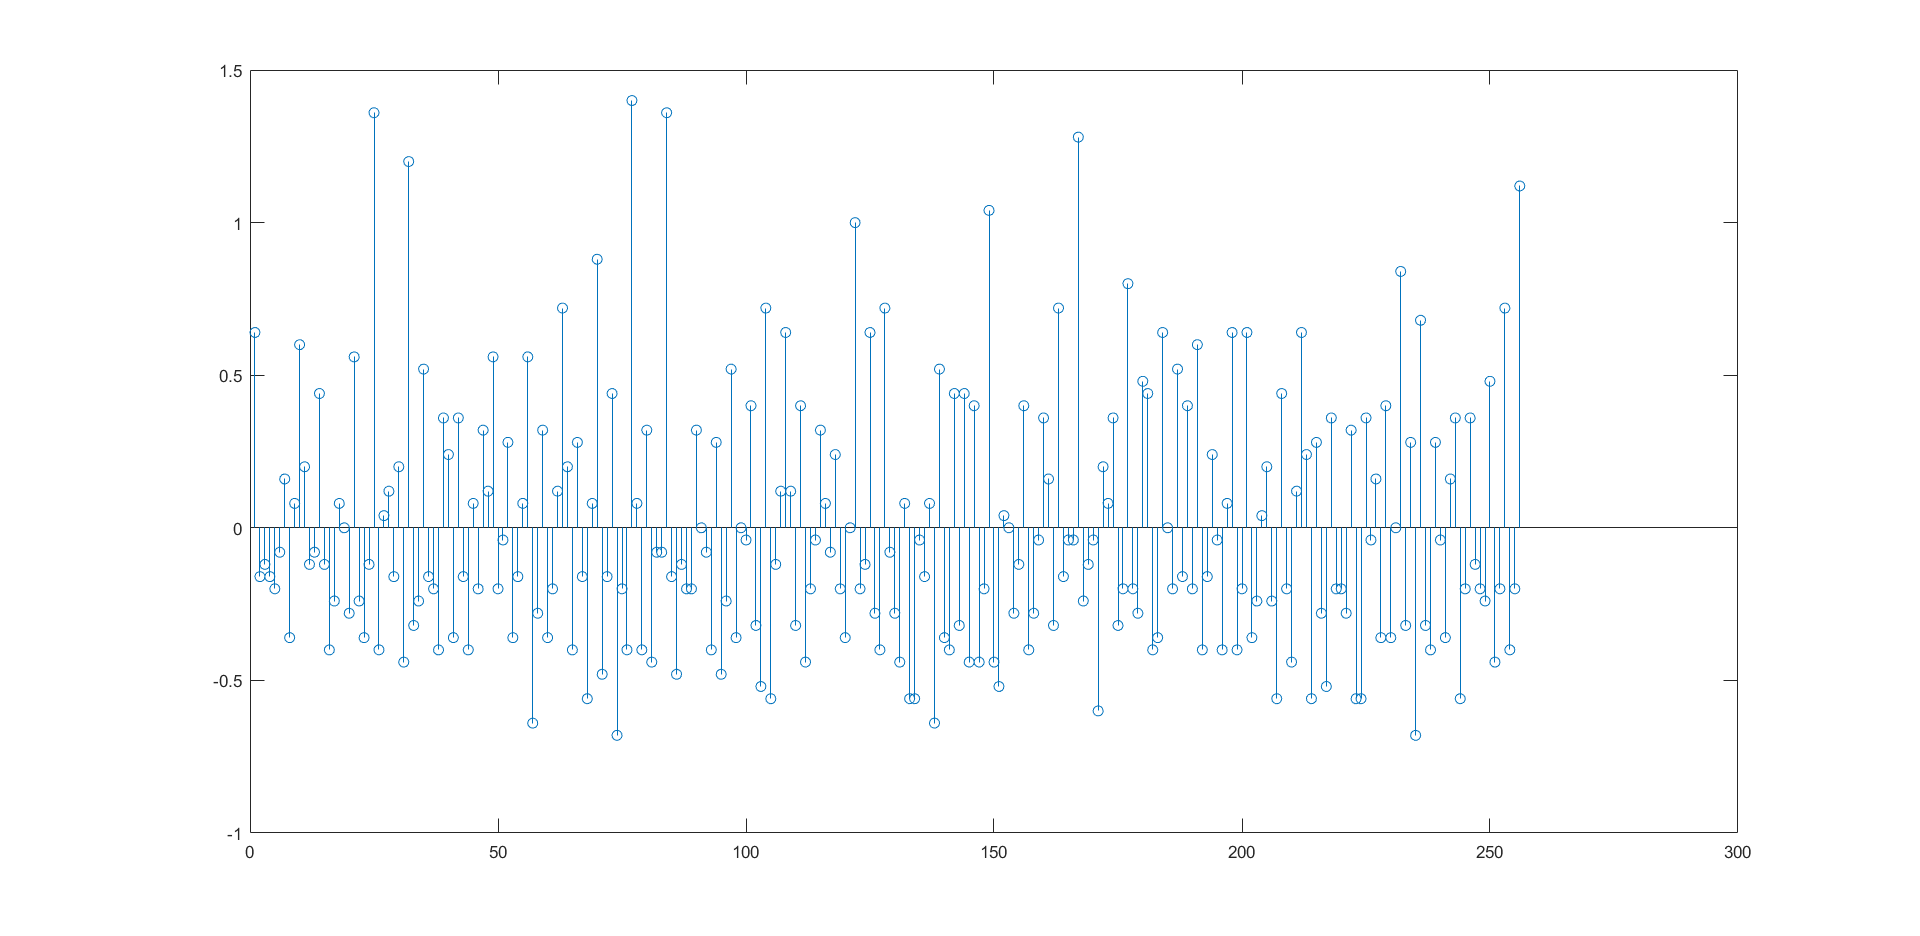
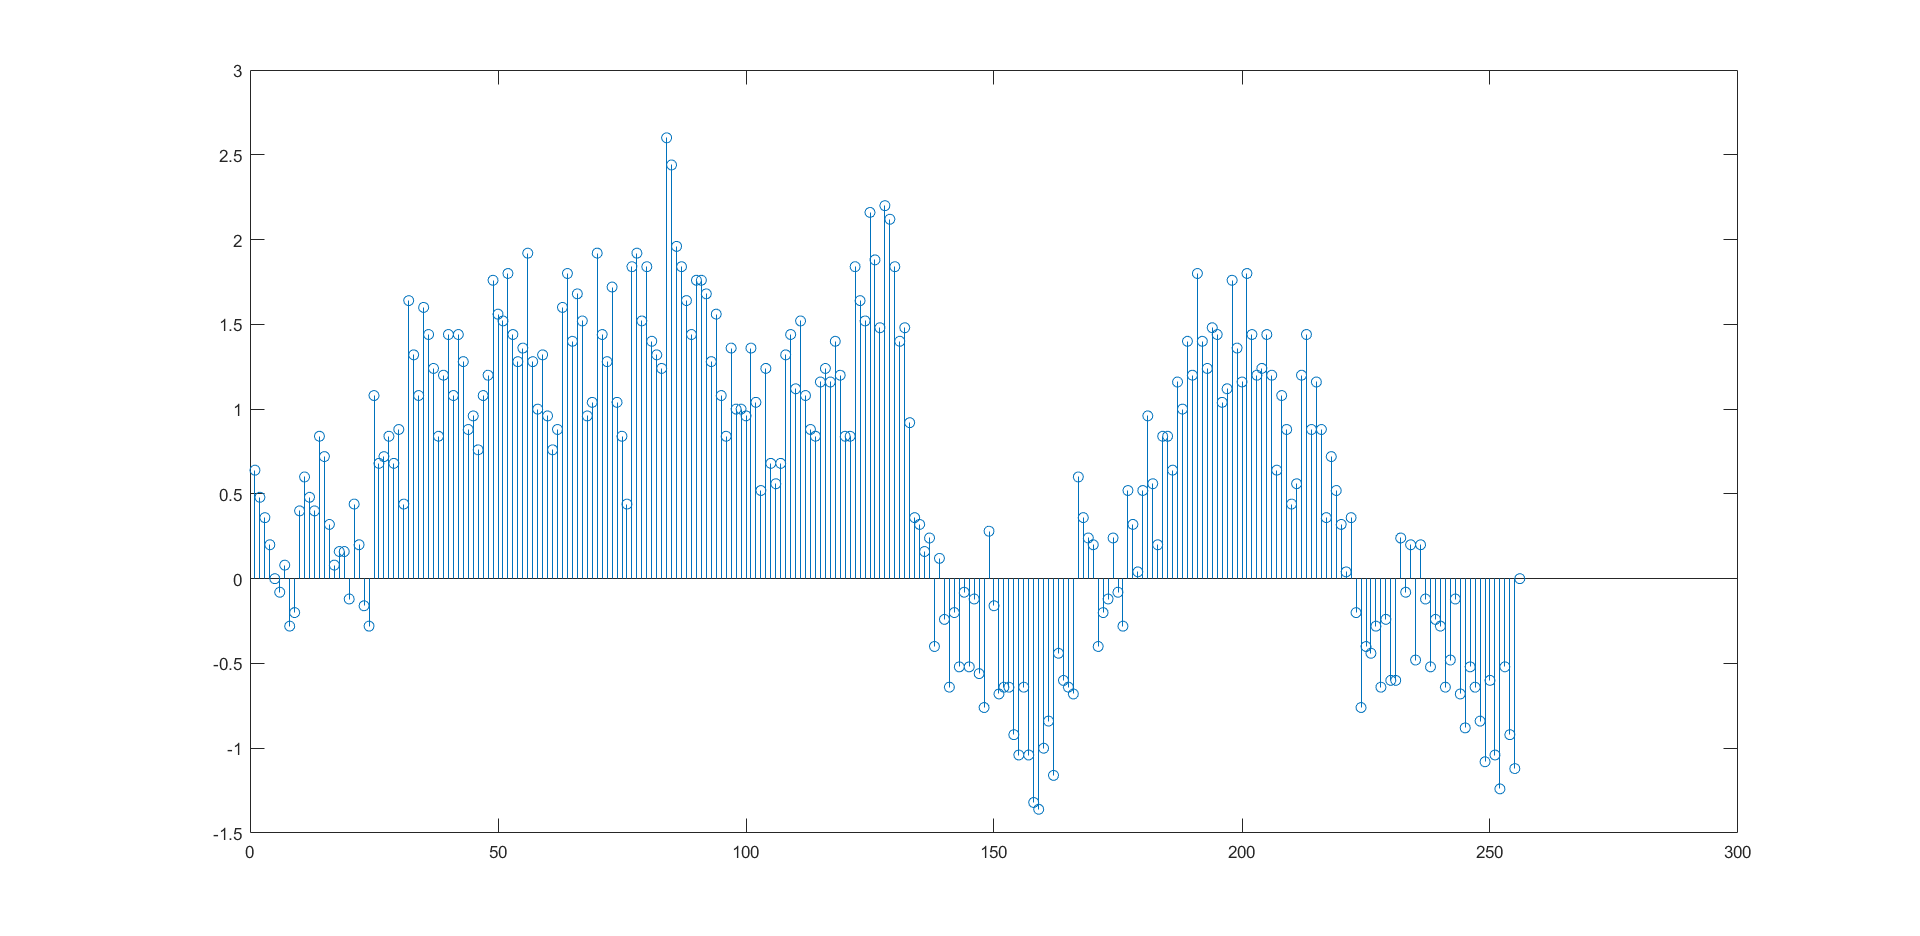
Based on the plots created in MATLAB, the maximum DNL and INL were obtained to be 1.400 and 2.600 LSB,respectively.
Noise - SFDR, SNDR and ENOB
For SNDR/SFDR calculations, oscilloscope data was taken into a csv file, which was then read through MATLAB and following FFT plots were obtained. Note, the peak occurs in 1KHz area.
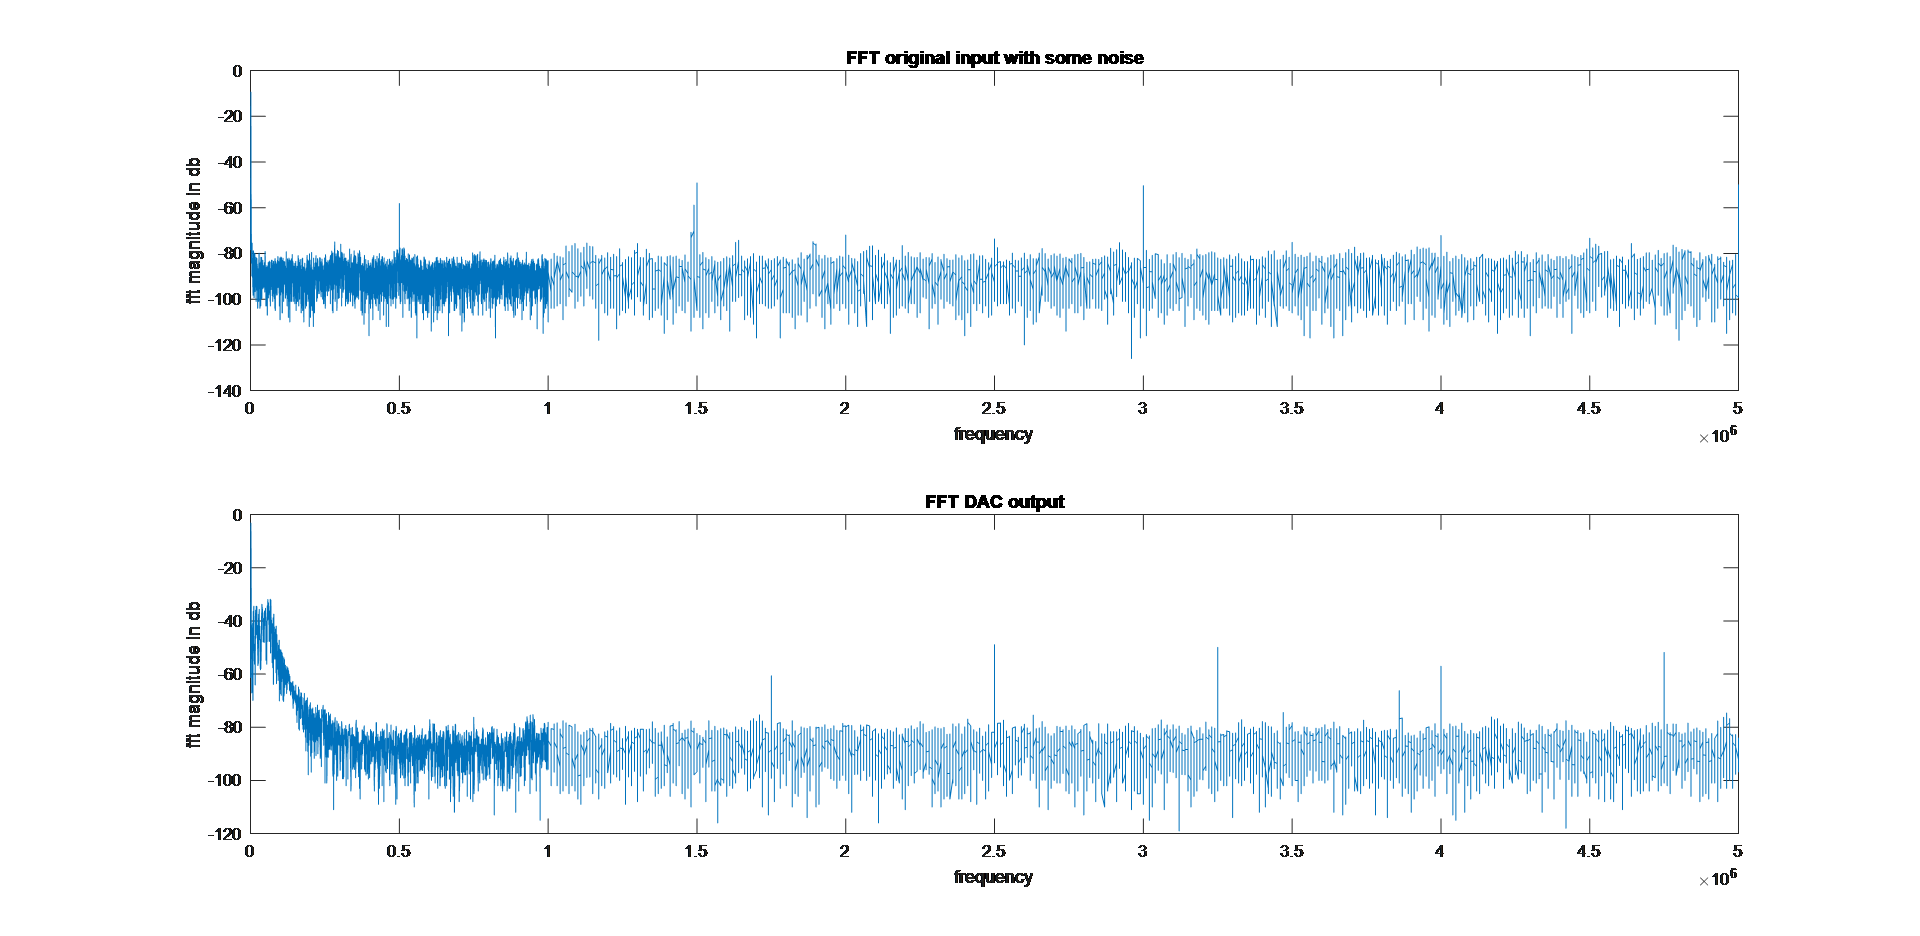
First to calculate the SFDR, difference between the first and the second harmonic were taken. This was calculated as 45.79 db. Thus, theoretical maximum ENOB obtained was 7.314 bits.
For more realistic ENOB calculation, signal power was computed within the band of .4 KHz around 1Khz. The rest of the output FFT data was considered noise, whose RMS was calculated. This was subtracted from the input noise, and the resulting difference was converted to db-scale. The SNR obtained as difference between signal power and noise power in db was 41.2047.
From this, ENOB was calculated using the following equation:
ENOB = ((signal power in db - noise power in db) - 1.76)/6.02
Hence ENOB was 6.552 bits from SNR calculations.
Power computation
In the ADC-DAC circuit, 1.2 V was given as VDD. A 2-ohm resistance was connected between supply voltage and input pin of the ADC. The difference in the voltage was observed to be 300 uV. This was due to reference current in the comparator. Hence, drawn reference current was calculated to be 150uA. Hence, DC power consumed = VDD * I = 1.2 * 150 = 180 uW. For the AC power (which defines the power consumption of the chip), the AC current drawn from just ADC was found to be 2.8 uA. Thus, power calculated was 1.2*2.8 = 3.36 uW.
SUMMARY
Following are the system level results obtained from ADC chip measurement:
| Parameter | Value |
|---|---|
| Technology | IBM 130nm CMOS |
| Analog supply voltage (AVDD) | 1.2V |
| Digital supply voltage (DVDD) | 1.2V |
| Sampling Rate | 200 KS/s |
| Resolution | 8-bit |
| SFDR | 44.79 dB |
| SNDR | 41.20 dB |
| Max DNL | 1.400 |
| Max INL | 2.600 |
| Power Consumption | 3.36 uW |
| Effective Number of Bits(ENOB) | 6.55 |
| Input Swing/ Supply Voltage | 1.2 V |