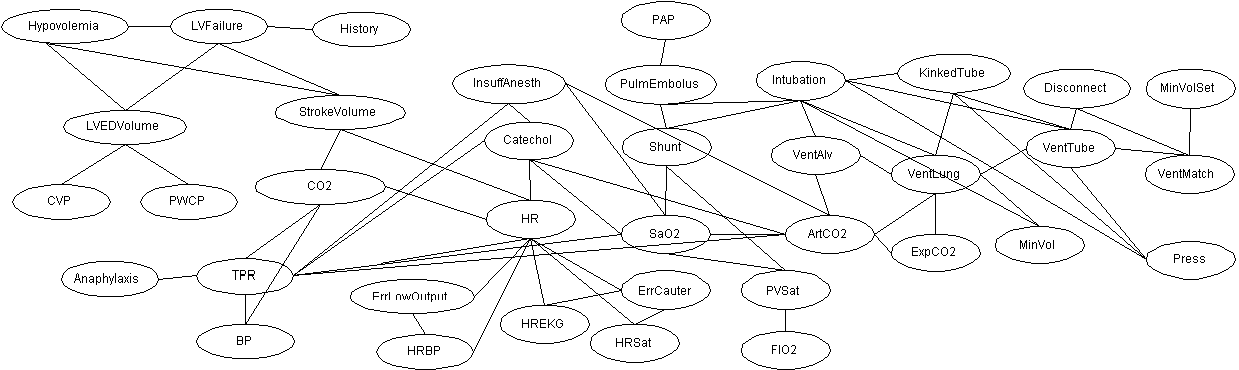
The moralized graph for the ALARM network is below.
The maximal cliques are as follows (the joint probability function can be factored into a product of potential functions over these cliques):
1. Hypovolemia, LVFailure,LVEDVolume
2. LVEDVolume, CVP
3. LVEDVolume, PWCP
4. Hypovolemia, LVFailure, StrokeVolume
5. LVFailure, History
6. StrokeVolume, CO, HR
7. CO, TPR, BP
8. Anaphylaxis, TPR, BP
9. InsuffAnesth, Catechol,TPR,SaO2,ArtCO2
10. ErrLowOutput, HRBP, HR
11. Catechol, HR
12. HR, HREKG, ErrCauter
13. HR, ErrCauter, HRSAT
14. PAP, PulmEmbolus
15. PulmEmbolus, Shunt, Intubation
16. PVSat, Shunt, SaO2
17. PVSat, FlO2
18. Intubation, VentAlv, VentLung
19. VentAlv, VentLung, ArtCO2
20. Intubation, KinkedTube,VentLung,VentTube
21. ExpCO2,VentLung, ArtCO2
22. Disconnect, VentMatch, VentTube
23. MinVolSat, VentMatch
24. Press, Intubation, KinkedTube, VentTube
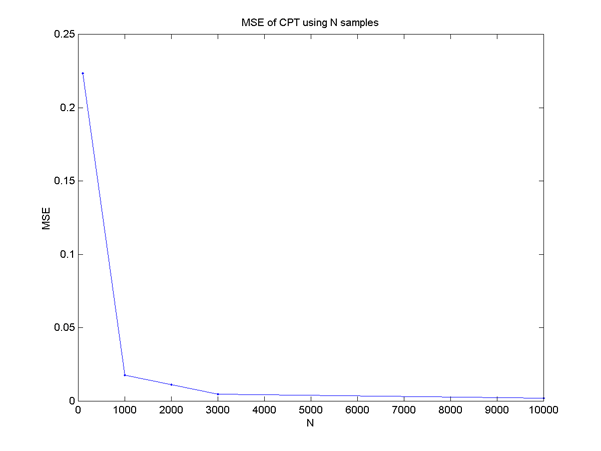
To test my LearnNet code, I fed the answer back into SampleNet, trained again on the output, and compared the results to the original probability tables. In detail: I first ran it on dataset5 to get an initial probability table. Then I used SampleNet to generate increasing numbers of samples (up to 10,000), and trained new cpts on this data. I compared the original probability tables and the new tables by calculating the mean-squared error. Each data point is the average of 5 runs. The evaluation code is here. The plot below shows convergence of the probability tables estimated with LearnNet to the "true" probability tables used to generate the data using SampleNet.
The cpts learned for dataset5 are below. The log likelihood was -374.7600.
4.3333333e-001  5.6666667e-001 -1.0000000e+000 -1.0000000e+000 -1.0000000e+000 -1.0000000e+000 -1.0000000e+000 -1.0000000e+000
8.6538462e-001  1.3461538e-001  5.1470588e-001  4.8529412e-001 -1.0000000e+000 -1.0000000e+000 -1.0000000e+000 -1.0000000e+000
5.7777778e-001  4.2222222e-001  1.0000000e+000  0.0000000e+000  4.2857143e-001  5.7142857e-001  2.1212121e-001  7.8787879e-001
3.9024390e-001  6.0975610e-001  3.5897436e-001  6.4102564e-001  3.5714286e-001  6.4285714e-001  3.0769231e-001  6.9230769e-001
7.6190476e-001  2.3809524e-001  3.5294118e-001  6.4705882e-001  7.2727273e-001  2.7272727e-001  3.9534884e-001  6.0465116e-001
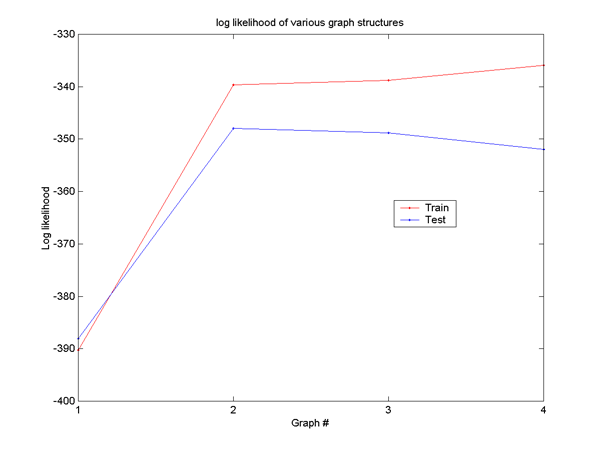
The plot below shows the log likelihood of the data under the ML parameters, for the various graphical models. It appears that model 2 (the straight Markov Chain) is the model that generated the data. Notice that the training likelihood increases monotonically with the number of parameters, so it is not suitable for making this judgement. The reason this occurs is because the likelihood