Dan Ellis: Research
Projects:
Sound Browser/Visualization
One of the characteristics of research into sound analysis is the large
amount of data involved. Sound is in itself a fairly voluminous data stream,
and it is the subtlety with which information is represented within it that
makes the whole research area so rich. In addition, techniques of statistical
classification, and the procedures of empirical evaluation, often call for
large collections of sound examples.
Confronted with such large volumes of data, it becomes critical to have
efficient and convenient tools for inspecting and investigating the data.
Particularly in the early stages of investigating a new research idea, it
is valuable to be able to inspect the data both at the input
and output of algorithms to get a 'feeling' for what is happening,
to diagnose unexpected results, and to identify new opportunities for analysis
and processing.
We use many different kinds of represtation in our work on sound analysis.
In addition to the basic waveform, there are time-frequency representations
of the spectrogram family, scalar or vector features resulting from analysis
algorithms, and discrete labels for particular time ranges generated by
classifiers. Ideally, we want to be able to visualize each of these data
sets in the most convenient form, and to be able to make direct comparisons
between data sets corresponding to the same underlying sound, even when
their formats may be very different. Each new question may require a new
form or configuration of the display elements, so the tool needs to be very
flexible and easy to extend for new datatypes.
Although an effort to ennumerate all the possible dimensions of any dataset
we may ever wish to work with, certain aspects seem universal. At the top
level, there is the dimension of soundfile within a corpus: the sound visualization
should probably be invoked from a kind of database manager that allows browsing
among the different examples in a database, and that keeps track of the
correspondence between the base waveform files and their analyses in the
various other representations (which may occur in separater files, or as
records in a single large archive file).
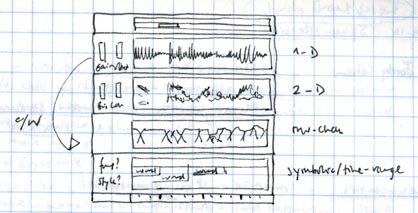
Within the sound display, the main organizing dimension is the time axis,
since all sounds have a finite, usually explicit, duration. As in the sketch
above, this can be used most successfully when various data displays share
a common left-to-right time axis, and are displayed in a stacked, synchronized
pattern. Other dimensions that may apply to multiple representations are
the channel within a sound (e.g. for stereo, or for the 16-channel meeting
recordings) and frequency (e.g. a separate plot of vertical 'slices' through
a spectrogram, where frequency becomes the x-axis, with the vertical axis
indicating intensity.
The different data formats that it will be necessary to support include:
- Basic waveform display, which can get tricky for very long files displayed
at a very compressed scale.
- Basic spectrogram display, i.e. a time-frequency display in grayscale
or pseudocolor. This can be calculated on-the-fly to avoid having to store
it in a separate file. Interactive adjustment of time-frequency tradeoff
factor, and colormap range and scaling should be provided.
- Other 1-D datasets with uniform time sampling, such as the output of
an energy level detector. A variety of file formats should be supported,
depending on what is in use. In certain cases, plotting several 1-D functions
on a single set of axes may be desirable, as for instance with posterior
probabilities, which are often dominated by a single value.
- Other 2-D datasets read from file, but displayed like the spectrogram.
- 3-D datasets (such as the within-channel short-time autocorrelation
a function of time, frequency channel and autocorrelation lag) are
hard to handle. Sometimes they are shown as animations. We could pick out
frames corresponding to the current 'window center' time.
- Discrete label tags, for instance, time-aligned word hypotheses coming
out of a speech recognizer. It is very valuable to have these aligned with
the underlying features, even though the representations are so different.
.. and doubtless many others.
The development of an in-house visualization solution would include:
- Evaluation of existing tools. Even though we may need to have something
that has been developed in-house to allow customization and extension for
new projects, there may well be existing pieces that we can incorporate
or extend. Some related links are included below.
- Evaluation of development environments: Considerations include: cross-platform
portability, ease/rapidity of development and modification, accessibility
for sound data, compatibility with existing tools or libraries. Candidate
solutions include java, Tcl/Tk and Python. The multi-level approach, where
extensions to a scripting language like Tcl or Python are written and compiled
in C or C++, then executed individually as new additions to the scripting
language, seems particularly successful.
- Development of infrastructure/framework: Database/corpus manager, basic
display frame and base classes for time-oriented, stacking display panels.
- Development of data display widgets within the framework for different
data types and displays: waveform, spectrogram, 1-D, 2-D, etc.
- Development of tools for customization e.g. setting up new default
layouts, automatically opening particular files, or associating derived
file types with their parents, etc.
Some relevant, related ideas include:
- Snack, a set of extensions
for handling and displaying sound within Tcl/Tk, and Wavesurfer,
a sound editor based on Snack, by the same author, Kåre Sjölander.
- Transcriber, a tool for creating and browsing time-aligned text transcriptions
of audio recordings, that gets its sound functionality from Snack. We are
using Transcriber in the Meeting
Recorder project.
- I saw a very interesting talk by Lloyd Watts including an animated
sound viewer that had a zoomed-in section, to show you two levels of detail
at once. There are a few static screenshots on this
page from Lloyd's web page, but you had to see it really.
- Xwaves (and its label viewer, xlabel) are probably the best-known programs
used in the research community. They are expensive, however, and I'm not
even sure of their status since Entropic
was taken over by Microsoft. (This
page gives you some idea of the look of the program; unfortunately,
it's in German).
- recogviz
is one of several earlier attempts by me to build a sound visualizer of
this kind. It shows the various stages of representation in a running speech
recognizer. Related projects are pfview
and SPRACHdemo.
Last updated: $Date: $
Dan Ellis <[email protected]>